Physics Internal Assessment
Table of Contents:
Introduction | Statement of the problem | Hypothesis | Method | Diagram | Results | Conclusion | Related Websites |Go Up
Background:
Viscosity is a measurement of how much resistance a fluid has to potential flow paths. Fluids with higher viscosities are prone to take longer times to take the shape of the container they are placed in, while fluids with lower viscosities will face less resistance when changing their shape. The same applies when the container containing the fluid is in motion. Fluids with lower viscosities are quicker to react to accelerations of the container they are in, updating their shape with little resistance, while more viscous fluids take longer to react to similar accelerations.
In a situation where a container is partially filled with a fluid, the time it takes the container to roll the length of an inclined plane is affected by the viscosity of the fluid in the container. Less viscous fluids will impact the sides of the container more frequently as it rolls, and less viscous fluids will tend to change their shape less frequently, and these resulting forces will substantially change the time the container takes to roll down the hill.
My experiment aims to determine the effect that changes in viscosity of a fluid in a regular cylindrical container has on the time it takes the container to roll down an inclined plane.
I believe that when the results of my experiment are put on a graph with viscosity as the independent variable on the x-axis and time as the dependent variable on the y-axis, the resulting function will take on a parabolic shape, with fluids having significantly low and high viscosities taking the longest time to roll down a plane. I believe that there will be some mid-range viscosity that will surpass the others, having the lowest time. I believe that this will happen because for the trials containing a fluid with very high viscosity, the slow movement of the fluid will cause the container to roll at a slower rate, and for fluids with very low viscosity, the constant impacts of the liquid on the inner surface of the container will be counterproductive to the container’s roll speed. Viscosity is the resistance to flow of the fluid in the container. Time is the measurement of how long it takes the container to roll down a consistent plane. The controls are the length and angle of the plane, volume of the fluid in the container, temperature of the entire setup, and the container itself.
Description:
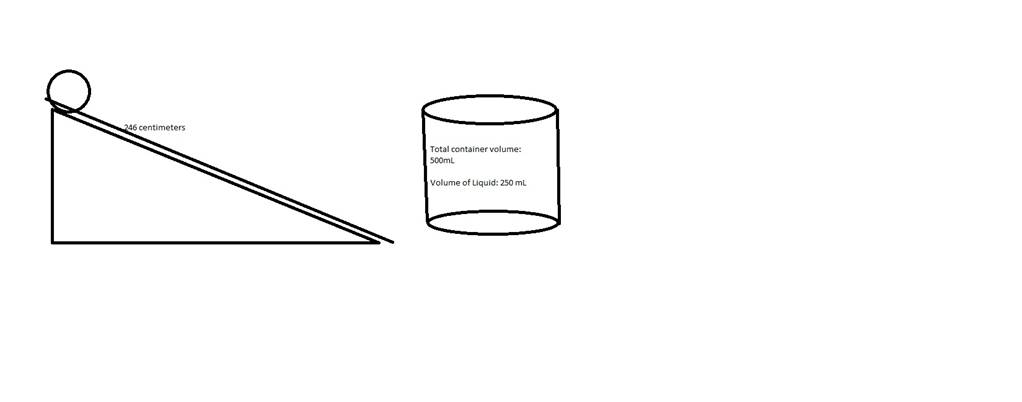
In order to gather the data, I utilized a cylindrical container, and a slope with a distance of 246 centimeters. The container was a volume of 500 milliliters, and to ensure that the impact of the liquid inside could fully exert force on the container, I kept the volume of the liquid in the container constant at 250 milliliters for each trial, half of the container’s total volume.
The time for each of the trials was measured as the time from the release of the container at the top of the incline to the point where the container had completed its journey to the bottom of the slope. I did this for five trials of each of the nineteen different viscosities, for a total of 95 data points, plus an average time for each viscosity.
In order to manipulate the viscosity of the liquid in the container, I started out with 250 milliliters of pure molasses. After taking the data for each of the trials of this variation, I added an amount of water to the solution, thereby diluting the solution to the proportion I intended. However, at this point, seeing as the solution was more than the prescribed 250 milliliters, I corrected for the extra solution by disposing of the surplus. Due to this process, the independent variable, viscosity, is measured as a percentage of water that the solution is. Water is less viscous than molasses, so it can be assumed that the trials with higher percentages of water are less viscous.
Graph:
From this graph and the corresponding trendline, it can be seen that throughout the entirety of the experiment, as the viscosity of the solution in the container decreased, so did the time it took the container to roll down the hill. The data most closely resembles a function of exponential decay.
To find the uncertainty of my data, for each of the variations of viscosity, I calculated the value of one half of the range of the numbers. From this method, I found the uncertainties of the trials for each solution to be as follows (in seconds): 0%: 1.4; 2.5%: 0.71; 5%: 0.66; 7.5%: 0.2; 10%: 0.205; 12.5%: 0.275; 15%: 0.21; 17.5%: 0.13; 20%: 0.11; 22.5%: 0.05; 25%: 0.14; 27.5%: 0.105; 30%: 0.065; 40%: 0.1; 50%: 0.145; 60%: 0.22; 70%: 0.13; 90%: 0.23; and 100%: 0.13.
From the findings of the data, the experiment failed to support my hypothesis, as there was no apparent bell curve seen in the data, where one central viscosity of the domain had a significantly lower roll time than the others. Instead, it was shown that a higher viscosity in a fluid consistently increases the amount of time it takes the container in which the fluid resides to roll. I would expect this to occur because the counterproductive forces I predicted to slow the roll of the container from the lower viscosity trials were either nonexistent or not significant enough to slow the container more than the resistance to flow of the relatively higher viscosities. I believe that the reason the trials with higher viscosities took longer because the more viscous the fluid, the greater the drag it had on the container’s roll velocity, substantially slowing its time. The extremely rapid decrease in time to roll with such small decreases in viscosity illustrates the importance to me of ensuring that when measuring and mixing fluids, precision is present.
For further research, I would wish to study more precise changes in viscosity, rather than large jumps, especially near the higher viscosity half of the graph, where small changes in viscosity had relatively large impacts on the amount of time it took the container to roll. Furthermore, I would wish to replicate this experiment using fluids with even higher viscosities than the ones used here, to see if the exponential growth curve remains accurate throughout.
I believe that altogether, the findings of my data are valid, as the methods used are legitimate, many data points were collected, and human error was worked to be kept at a minimum.
https://en.wikipedia.org/wiki/Viscosity – Webpage explaining what viscosity is
https://physics.info/viscosity/ - More information about viscosity
https://www.slideshare.net/Edwinsydney/factors-affecting-viscosity-of-a-liquid - Factors impacting Viscosity
https://www.hockmeyer.com/technical/publications/75-understanding-high-viscosity-mixing.html - Mixing Viscous Liquid
https://www.wired.com/2014/07/a-rolling-object-accelerating-down-an-incline/ - Cylinder Rolling Down an Incline
https://www.youtube.com/watch?v=EVwlMVYqMu4 - Hahaha