How does coefficient of friction of household items affect the distance a puck will travel at a certain velocity?
Table of Contents:
Background Hypothesis
Design Variables
Data Calculations
Graph Analysis Conclusions Limitations Related
Websites
Background:
I am building a miniature at-home hockey rink and will need to know which material will make the best base. I am looking for the material that will cause the puck to travel the longest distance after a force is applied to it. I am going to college on the east coast and hockey will soon become a larger part of my life, so I am eager to learn more about it and the physics working behind the sport. As someone who finds many of their interests lies in the arts, I have a hard time finding ways for physics to relate to my life or really catch my eye. I know that the application and fundamental theorems of physics can be seen everywhere in the real world and do not need a lab to be proven, yet my struggle remains. For this reason, I wanted to use household items to make any conclusions I reach more meaningful and relevant to my life; because I will use the items listed in my “Design” section regularly, I can see how something that is fundamental for physics, friction, and something IB Physics has taught me, the coefficient of friction, can be seen in my own life.
The coefficient of static friction is defined as “a number that proposes the amount of force required to get an object to move along another object whilst being held back by friction and pressed together” (Coefficient of Friction). Leonardo Da Vinci, was “one of the first scholars to study friction systematically” (History of Science Friction). He noted the relationships between weight and friction, but some scholars and scientists after him studies friction in relation to time. The scientist who established the laws surrounding coefficient of friction was named Guillaume Amontons, and the law of his that I will focus on is his second: “Friction force is independent of the apparent contact area”. What this basically means is that each coefficient of friction is special for each set of materials. This made me consider how the time it takes for differing materials to move against one another would change the friction coefficient.
The concept of friction in relation to Newton’s first law, an object in motion stays in motion unless acted upon by an outside force, is often studied because it is a phenomena seen in the real world on a regular basis. The object stopping another object’s motion is often rarely another physical object, but friction. This was interesting to me because the two laws work together to create something that is easily looked over, but fundamental and obvious in the real world.
Friction is caused by the objective roughness of the objects running against each other, causing them to slow down until they eventually stop. It takes time for it to do this Because it is so relevant in reality, I took an interest in how the coefficient of friction works: how it is calculated, where it comes from, and how it relates to things we can see and measure with the naked eye. Something essential to the calculation of the coefficient of kinetic friction is acceleration because, on a fixed plane, it is the only thing that causes the force to change.
Acceleration comes from how fast an object is moving along a plane, and can be calculated easily with the time and distance of an object with a fixed mass. When it is simplified this far, time is essential in calculating the friction forces and, in turn, coefficient of friction.
This all led me to question how friction and correlation coefficient were related, and what the driving force of the change was, as they were clearly related in some way because one leads to the other. Therefore, the problem I aim to solve is: how does coefficient of friction affect the distance a puck can travel at a given velocity?
Hypothesis:
If a puck is projected forward at a given velocity on differing materials, then the puck will travel the furthest on the material with the lowest coefficient of friction. I predict that the whiteboard will have the lowest coefficient of friction because it appears to be the smoothest, which would lead to less friction between the cardboard “puck” and its’ own surface.
Design:
This investigation was designed to determine how coefficient of friction affects the distance a puck can travel. In order to do this, I created an incline on a 90 degree angled wall and calculated the constant angle of the incline, which was 31.982 degrees. I then took a small cardboard box with a weight inside of it as my puck, weighing 0.0921 kilograms, and slid it down the incline 10 times, timing each time it slid down from when the top of the box crossed the top of the incline to when the top of the box reached the bottom of the incline. I did this with my five household items (in this order): whiteboard, 100% cotton fabric, felt, printer paper, and cardboard, all on a solid surface. I use vastly different materials so the times will be more likely to vary enough to show a relationship. The time of each of the items will later be used to calculate acceleration, so I took an average of the data collected for each item and used that value for my calculations. I use the incline because it is the easiest and most efficient way to gather the coefficient of frictions, then I will use that number in another equation to find the distance at a given desired velocity; for simplicity’s sake, the constant input will be 6 meters per second.
Variables:
Controlled Variables: The controlled variables will be the angle at which the incline sat, the weight of the box being slid down the incline, and the length of the plane. It is very important that all of these things remain constant so there will be a direct correlation between time, and, therein, acceleration, and the coefficient of friction without any of these factors being a potential driving cause for the changes or trends.
Independent Variable: My independent variable is going to be the material used on the incline, i.e. whiteboard, 100% cotton fabric, felt, printer paper, and cardboard.
Dependent Variable: The dependent variable in this investigation is the time taken to slide down the incline, as that will change with each of my independent variables.
Data:
Raw Data: (seconds)
|
|
Trial 1 |
Trial 2 |
Trial 3 |
Trial 4 |
Trial 5 |
Trial 6 |
Trial 7 |
Trial 8 |
Trial 9 |
Trial 10 |
Average |
|
Whiteboard |
0.65s |
0.55 |
0.69 |
0.60 |
0.65 |
0.68 |
0.59 |
0.60 |
0.64 |
0.61 |
0.626 seconds |
|
100% Cotton |
1.21s |
1.06 |
1.16 |
0.83 |
0.88 |
1.00 |
0.97 |
0.94 |
0.87 |
1.01 |
0.993 seconds |
|
Felt |
0.89s |
0.66 |
0.82 |
0.65 |
0.66 |
0.74 |
0.66 |
0.80 |
0.79 |
0.69 |
0.736 seconds |
|
Printer Paper |
0.63s |
0.52 |
0.49 |
0.50 |
0.61 |
0.50 |
0.55 |
0.62 |
0.50 |
0.53 |
0.545 seconds |
|
Cardboard |
0.65s |
0.56 |
0.66 |
0.50 |
0.55 |
0.64 |
0.55 |
0.66 |
0.50 |
0.51 |
0.578 seconds |
Calculations: Back
to Top
In the following equations, I will use variables, defined as follows:
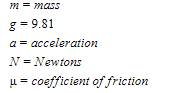
All measurements are in meters and masses in kilograms.
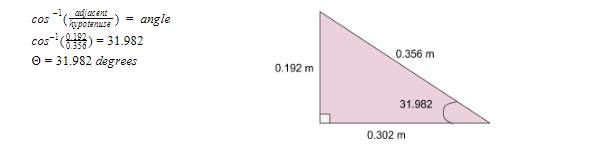
The first thing I needed to calculate for this investigation was the angle at which the incline stood because I needed the information to use in later equations: the dimensions were 0.356 meters (14 inches), 0.192 meters (7.56 inches), and 0.302 meters (11.875 inches). Because the angle formed a right triangle, I was able to use inverse cosine, resulting in an answer of 31.982 degrees.
To find the coefficient of kinetic friction for the five different items, I had to use three steps, laid out as follows:
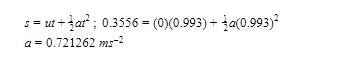
1. I used this equation of motion to calculate the acceleration, which was used in the next step:
![]()
2. This step required multiple different equations derived from how a box is able to slide down an incline:
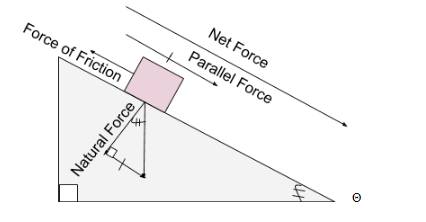
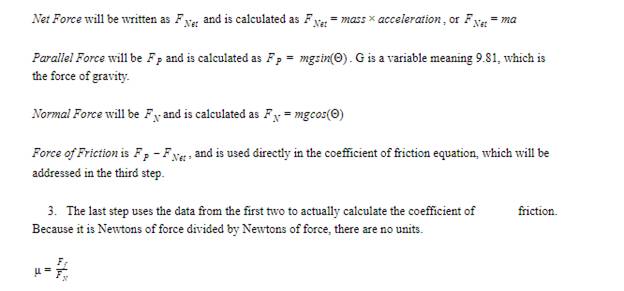
Each of these steps will be used for the five materials.
Whiteboard - Average time: 0.626 seconds
Step 1:
![]()
Step 2:
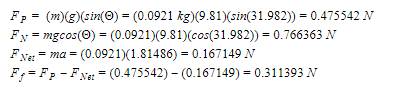
Step 3:
![]()
100% Cotton Fabric - Average time: 0.993 seconds
Step 1:
Step 2:
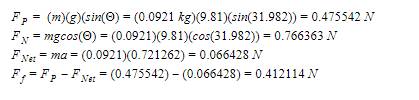
Step 3:
![]()
Felt - Average time: 0.736 seconds
Step 1:
![]()
Step 2:
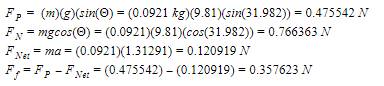
Step 3:
![]()
Printer Paper - Average time: 0.545 seconds
Step 1:
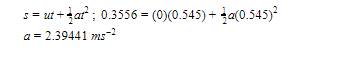
Step 2:
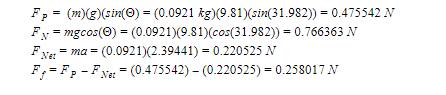
Step 3:
![]()
Cardboard - Average time: 0.578
Step 1:
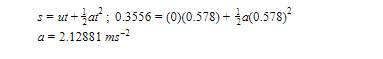
Step 2:
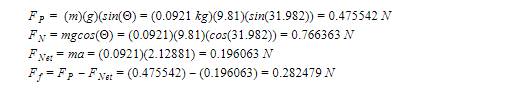
Step 3:
![]()
Using these coefficients to solve for distance at velocity 6 m/s:

100% Cotton Fabric: 6.8242 meters until stop
Felt: 7.8667 meters until stop
Printer Paper: 10.8998 meters until stop
Cardboard: 9.9559 meters until stop
Graph:
|
Coefficient of Friction (x) |
Distance Traveled (y) |
|
0.406326 |
4.5160 |
|
0.537753 |
3.4121 |
|
0.466649 |
3.9334 |
|
0.336677 |
5.4499 |
|
0.368597 |
4.9780 |
Analysis: Back
to Top
The data showed a negative, non-linear correlation, and there is a clear correlation between distance and coefficient of friction. The furthest theoretical distance, 5.4499 meters, was partnered with the lowest coefficient of friction, 0.336677, for the printer paper. The shortest distance was 3.4121 meters for the 100% cotton fabric, which had a coefficient of friction of 0.537753. The rest of the data followed suit, with the correlation coefficients inversely matching the order of the distances. It is interesting that the relationship is not linear when all other potential variables in the experiment remained constant. The fact that the two things show and inverse relationship confirms that a lower coefficient of friction means that there will be less holding an object back from moving, therefore it will be able to travel a greater distance before coming to a stop. This data is successful in showing me which object would be the best to use as the flooring in a miniature hockey rink because it shows not only how the coefficient of friction and distance relate and why they are relevant to each other, but also which material will allow for the most distance traveled, and how severe that change may be from a relatively small change in coefficient of friction.
Conclusion:
In conclusion, my data was successful in showing which material would make for the best flooring of an indoor hockey rink, and that material is printer paper. The printer paper allowed for the greatest distance to be traveled and would allow the puck to move as freely as possible out of these options. My hypothesis was correct in that the object with the lowest coefficient of friction allowed an object to travel the furthest, but I was incorrect in choosing which material I thought would have the lowest coefficient of friction. It was actually the printer paper; the whiteboard was not even the second best option, it was third with a coefficient of friction of 0.406326 and a distance of 4.5160 meters. I felt that a sample velocity of 6 m/s was prudent because it resulted in small enough distances that they would be realistic inside my miniature hockey rink, which is fairly small. I found that the distance was longest when the coefficient of friction was smallest and vice versa, and this is consistent with the definition of friction.
Through my experiment, I was able to see not only what the best base would be for a miniature hockey area when I want the puck to move around quickly, but also was effective in showing how physics can be applied to my daily life. My data is relevant in solving my problem, which is what base material to use, and answers my question using not observation, but rather physical evidence applied to a theoretical equation, solidifying my conclusion and verifying which material would be the most efficient for my goal.
Limitations:
My limitations in this experiment would all be accounted for by human error. Since all the time measurements were taken by hand, the validity of the times could be more questionable than had they been done by a machine that would be able to distinguish exactly when the top of the box leaves the top of the incline to exactly when the top passes the bottom of the incline. In an attempt to limit the threat of this error, I did 10 trials for each item and took the average time. The uncertainty could not be calculated for this experiment, but it had no effect on the trends of my data, because the correlation between the times does not need to be connected exclusively to the items I used. Another limitation was the short length of the incline.
The best way to avoid the harm of this uncertainty was by doing 10 trials and taking the mean of the time of the data, however, to improve the validity of my data as related to the materials, more trials may be more beneficial.
A way to strengthen the conclusion of my experiment would be to try to validate the coefficients of friction that I solved for by actually sliding the puck across these materials and seeing the error in the data and how it differs from reality, and identifying why those errors are present.
For future studies, I would use a set distance rather than a set velocity to see how much speed I can get from a puck on these materials across my hockey rink that will be 6 feet in length to see if I really want the material that will make the puck go fastest, or if it would be more practical to use another material that would make playing anything in this rink realistic and enjoyable.
Related Websites Back to Top
“History
of Science Friction.” History of Science Friction, Tribology, www.tribology-abc.com/abc/history.htm.
This is an interesting article about the way coefficient of friction was developed and interpreted throughout history, including the scientists that helped discover it.
tribonet. “Coefficient of Friction.” About Tribology, Tribonet, 2 June
2017, www.tribonet.org/wiki/coefficient-of-friction/.
This article
shows the more technical side of coefficient of friction, including how it is
calculated and its applications.
https://me-mechanicalengineering.com/friction-coefficient-applications-advantages-disadvantages/
This
article is interesting because it shows not only the values of coefficient of
friction, but also the limitations in its applications, which gives a more
rounded view of its value.
This
article had more applications of the coefficient of friction similar to the one
used in this research paper.
This was an
interesting and out-of-the-box application to coefficient of friction in office
life, revealing its relevance in all different lifestyles.