By: John Hensley
Background
Information .:. Method .:. Pictures
.:. Graphs .:. Conclusion .:.
Bibliography .:. Go Out
Background
Information
All electricity generating
systems that exists consists of something spinning to generate that electricity
except solar panels. Hydroelectric dams harness the kinetic energy of falling
water by making the water pass through turbines, which makes the turbines spin.
Similarly, wind turbines spin from air passing by. There are even turbines in
nuclear and coal power plants that spin when steam, heated up from fission or
combustion, rises. The faster these things spin the more volts they produce,
and in an electric motor, the more volts that are pumped in, the faster the
motor should spin, as long as the load is constant. Voltage can be described as
the water pressure of electricity. If the water pressure in a pipe increases,
the water will come out of the pipe with more force. So if the voltage is
increased, the motor has to put in more work faster. For a fixed voltage, the speed of the motor is
proportional to the torque load applied to the motor. The motor’s torque is
proportional to the applied current, no matter what the voltage. The purpose of this experiment is to find out the relationship
between voltage and rotations per minute. I believe that as the voltage
increases, the RPM’s will increase as well. This will happen because of the law
of conservation of energy.
Method
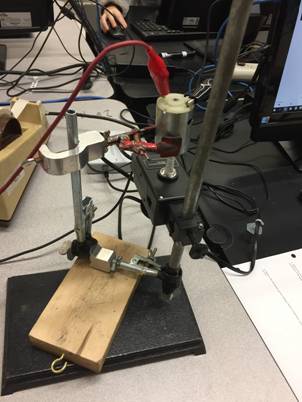
To do this I connected a small dc motor to a rotary motion sensor and routed
the power supply to the motor through a voltage manipulator. The rotary motion
sensor sent the data it collected to a computer which organized the data into
two line graphs using Lab Quest Mini and Logger Pro. One graph for velocity in
revolutions per second and one graph for angle in revolutions for 300 seconds.
I did this three times per voltage and did three voltages. I used the voltage
manipulator in the picture to the left to alter the voltage and used the meter
to the left to measure voltage and the meter to the right to measure amperes.
Pictures
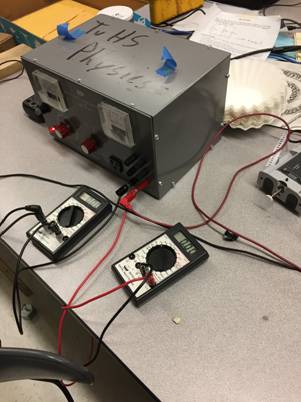
The voltmeter has an uncertainty of ±0.1V and the ammeter has an uncertainty of
±0.01A. The actual data collected (velocity) has an uncertainty of about ±3.4
rev/s. This is mostly because of the lack of stability is this setup and the rotary
motion sensor’s max velocity (wouldn’t compute velocities over about 24 rev/s).
Graphs
Go Up
Potential @ 0.87 volts Raw Data
Data File: Text1
.:. Text2 .:. Text3 .:. Excel
Potential @ 1.22 volts
Potential @ 1.2 volts
Conclusion
The change in stability from graph one to graph three is due to a
change in the set up. I found a much more stable set up after taking the data
for graphs one and two and before taking the data for graph one. This could be
why it took much less voltage in graph one to get the same trend in velocity as
graphs two and three.
This data did not support my hypothesis, in which the RPM’s would increase as
the voltage increased. However if I had either a slower motor or a much better
rotary motion sensor I believe my hypothesis would’ve been correct. Using
equations from simplemotor.com/calculations/ I found that RPM=(2πτIV)/(60η) where
RPM is rotations per minute, τ is torque (Newton-meters), I is current
(amperes), V is potential flowing into the motor (volts), and η is
efficiency of the motor (no units). If I wanted to do further and better
research I would use something more stable than a ring stand, three clamps, a
block of wood, and duct tape. I would also try to find a rotary motion sensor
that could compute higher velocities.
Bibliography/Related
Websites Go Up
http://www.me.umn.edu/courses/me2011/arduino/technotes/dcmotors/motor-tutorial/
https://www.researchgate.net/figure/Graph-of-DC-Voltage-v-s-Speed-in-RPM_fig7_305683710