Davis Payton
Ethan Duong
Jackson Redding
Cameron Perry
Travel Time and Distance of Baseballs in Reference to Velocity and Angle of Launch
Baseball was one of the first sports brought into American culture in 1839, and remains a very important aspect of modern athletics. The game uses a baseball in which a pitcher throws it to a batter who tries to hit it with a bat. These balls are very effective in the sport, and are also effective in physics experiments. Each baseball has very specific regulations involving the mass, the circumference, the type of materials used, and the amount of materials. The typical baseball has an acceptable mass ranging between 141.748 and 148.835 grams, and a legal circumference in the range of 22.860 to 23.495 cm (2017 Official Baseball Rules). The construction of a baseball starts with a cork and layered rubber core with wound yard on top. The consistency of the yarn windings include 121 yards of rough gray wool, 45 yards of white wool, 53 yards of fine gray wool, and 150 yards of fine white cotton layered in that order. Two pieces of horsehide are then hand-stitched in a figure-8 shape with 108 stitches to cover the ball (Stamp).
In this experiment, energy can be stored in a baseball when acted upon by an outside force, resulting in motion. This is known as Newton’s first law of motion (“Newton's First Law”). The motion of the baseballs is a result of two tires or wheels on a pitching machine rotating at the same speed. Since each wheel is spinning at the same velocity, this eliminates adverse spin on the ball in order to help it fly in a traditional parabolic arc. That way, we can use the arc and “SUVAT” formulas in order to find the distance traveled, the time in the air, the initial and final velocities, the acceleration, and the maximum height of the ball. Due to the fact that the baseball is launched at an angle, the ball will have both a horizontal and vertical component of velocity and force. The fastest vertical component of speed is right when the ball is launched because gravity hasn’t had the time to decrease the ball’s vertical acceleration; however, the speed will be the same at the instant before impact, except in a downward movement. In theory, the ball will have zero vertical velocity at its highest point in the trajectory, and its horizontal velocity will remain constant throughout the duration of the flight.
The purpose of this investigation is to find the relationship, if any, between the initial launch angle and velocity of a baseball, and the resulting hang time and displacement of the baseball’s trajectory.
Description of Question:
When baseballs are launched out of the Jugs pitching machine, the initial velocity counteracts the force of gravity which sends the ball flying into the air; however, the velocity of the baseball decreases due to the resistance of air friction and the imposing force of gravity, eventually bringing the ball back down to earth. The purpose of the experiment is to measure the peak height of the trajectory which will change in relation to the initial launch velocity and angle of elevation.
If a baseball is launched at a greater initial speed and angle (up to 45 degrees), then the resulting displacement and hang time of the baseball will also be greater due to the increased vertical and horizontal vector force on the ball.
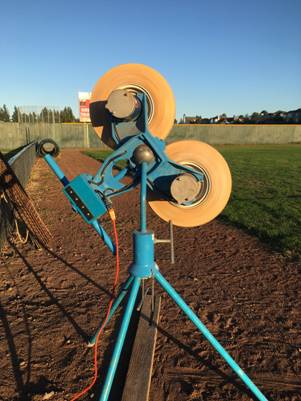
● 1 Jugs Dual wheeled all purpose baseball pitching machine
● 1 handheld wheel meter counter
● 3 timers (cell phone)
● 1 foot long level & standard issue protractor taped to the flat surface of the level
● 1 2-meter by 14cm wood board used for marking the start line for measuring the distance
● 10-15 all leather standard baseballs
1. Set pitching machine at correct angle/speed using the dials and the leveler with the protractor. We start with one of our 4 angles (0, 20, 40,60 degrees) then launch 4 balls at each of the 5 speeds. (30mph, 45mph, 60mph, 75mph, 90mph) In total we launched around 80 balls. When adjusting the speed, be sure to let the machine warm up to the set speed for at least 60 seconds.
2. 3 second Countdown for timers to start and stop when ball has landed.
3. When the ball hits the ground, stop timers, and one person locates where the ball hit the ground as accurately as possible
4. Once location is found, one person starts from the wood board laid under the pitching machine, and measures the distance to the ball using a wheel meter counter.
5. Record times and distance.
6. Repeat for every angle and speed 4 times each.
7. After eight total launches, replace the baseball with an unused one.
To record the elapsed time the baseball spent in the air, three stopwatches were given to three people and there would be a countdown preceding the launch of the baseball. One timer was behind the pitching machine, one was next to the machine, and one was in the field where the ball would land. A minimum of three trials and a maximum of four trials were conducted for each variation. When beginning, the launches were not reliably consistent which is the reason for conducting an additional fourth test for more data. Later in the experiment after the machine was warmed up, the tests became more consistent which made a fourth test redundant. Each trial has the three recorded times in its respective cell. Two x’s indicated with “xx” were used in place of a time when a timer was unable to record a launch due to human error. Those trials may not be as accurate due to more variation in the travel time. Four x’s indicated with “xxxx” in place of the trial’s times are used to represent the lack of a fourth trial for the respective variation. The distance was calculated by using a handheld wheel meter counter.
Afterwards, the three (or two) recorded times were averaged into a single time for each trial. Then the four (or three) trials for each variation were averaged into a single time or distance, as seen above.
The theoretical values for time in the table above were calculated by using the following formula:
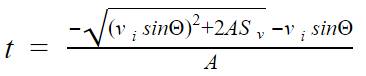
![]()
![]() is the initial velocity when launched from the pitching
machine and θ is the angle in degrees of the launch.
is the initial velocity when launched from the pitching
machine and θ is the angle in degrees of the launch.
The theoretical
horizontal distance was calculated by using the following formula:
![]()
Similarly,![]() is the initial velocity when launched from the pitching
machine and θ is the angle in degrees of the
launch. T is time in seconds from the preceding formula.
is the initial velocity when launched from the pitching
machine and θ is the angle in degrees of the
launch. T is time in seconds from the preceding formula.
The two tables
above are the percent errors of the different variations for time and distance respectively.
Generally, faster speeds and higher angles yielded results closer to the
expected SUVAT values which is true for every
experiment except the 40.2 m/s (90 MPH) test. Some theories for why the 40.2
m/s test was far from the expected values is from the faster winds since these
tests were conducted later in the day. Additionally, the ball may not leave the
machine precisely at the designated velocity which may be more prevalent in the
faster velocities. The faster velocities may also be less reliable in launching
the baseball without spin, since a spinning ball would affect the data due to
the Magnus effect.
The two graphs
illustrated above represent the travel time in seconds of a launched baseball
with a surface area chart with velocity and angle as the independent variables
and time as the dependent variable. The graphs are bounded from zero to sixty
degrees with twenty degree intervals and the velocities range from 13.4 m/s (30
MPH) to 40.2 m/s (90 MPH). The first graph serves as the theoretical and
expected values when calculating the launch with SUVAT arc problems whereas the
following graph presents the actual results.
Furthermore, the
two graphs illustrated above represent the elapsed distance in meters of a
launched baseball with a surface area chart with the same independent and
dependent variables as the two former graphs. Similarly, the first graph serves
as the theoretical and expected values when calculating the launch with SUVAT
arc problems whereas the following graph presents the actual results.
The effect of initial
velocity and angle on the hang time of a baseball:
After
conducting this experiment, it is quite evident that the results prove our
hypothesis. Both the data tables and the graphs suggest that the hang
time of a baseball increases with the velocity and the launch angle up to 90
degrees. Based on our results, the maximum hang time of the ball resulted
from a launch at 60 degrees and 90 mph, whereas the minimum hangtime
was developed from a launch at 0 degrees and 30 mph. For each individual
speed, the data proved that the hang time increased with angle. This is
due to the increased vertical force component on the ball as the angle
approaches 90 degrees. Vertical force is a function of sine, which is at
its greatest value at 90 degrees and its lowest value at 0 degrees. By
looking at the equation, the outcome makes sense since sine grows with the
angle. Another prominent trend in the data is that at any fixed angle
other than 0 degrees, the time the ball spends in the air increases with the
speed. This is also due to vector forces. A vector is simply a
value in a given direction, in this case, a speed at a certain angle.
When the speed increases, the vertical and horizontal magnitudes of the vector
do the same which results in the ball flying higher, thus spending more time in
the air, at any angle other than 0 degrees. At 0 degrees, the vertical
component is zero, due to the sine function. At zero degrees, the time
should stay constant at .53 seconds at any velocity according to the kinematic
equations; however, our findings show that the time continues to increase with
speed. This error is most likely a result of adverse spin on the ball
from the orientation of the seams and the speed of the wheels on the pitching
machine. When we combined these two patterns listed above with a launch
at 60 degrees and 90 mph, the hang time was the longest which proved our
hypothesis.
The effect of
initial velocity and angle on the horizontal displacement of a baseball:
After
conducting this experiment, it is clear that the horizontal displacement of a
ball increases as the velocity becomes greater, and the angle increases up to
45 degrees. Based on our results, a baseball launched at 90 mph at an
angle of 40 degrees produced the longest distance, while a ball shot at 30 mph
parallel to the ground resulted in the shortest distance. For each individual
speed, a trend remains consistent that the distance grows from 0 to 40 degrees,
and decreases after that. Although our experiment shows that 40 degrees
generated the longest distance, 45 degrees would be the optimal angle due to
the law of complementary angles. The distance of the launched baseballs
is equal to sin(2θ) X v²/g, where v is the
projectile's initial speed, g is the acceleration toward Earth due to
gravity and θ is the angle at which the projectile is
launched. Based on this equation, the given value of distance will be the
greatest when sin(2θ) is the greatest. The
largest value of the sine function is 1, with an input of 90 degrees.
Therefore, 2θ = 90, so θ equals 45 degrees (“How Should You Launch a
Ball to Achieve the Greatest Distance?”). For each individual angle, the
data also follows a pattern where the distance increases with speed. The
pitching machine was almost at max speed around 90 mph, but the distance would
continue to increase as the velocity approaches infinity. When we
combined these two trends at the maximum speed of 90 mph and the angle of 40
degrees, the distance was definitely the longest of all the trials. This
proved our hypothesis and the equations used.
Throughout
this experiment, there were many errors that could have impacted our
results. Perhaps the most impactful errors are the weather, the pitching
machine inconsistency, the spin of the ball, and the fact that we had to use a
new ball every few trials to ensure a constant mass and smoothness. In
regard to the weather, the winds, temperature, humidity, and pressure were not
constant throughout the experiment. Although we conducted the testing on
a relatively calm day in October, the winds definitely played a role in where
the ball landed, and the humidity, pressure, and temperature increased the air
density as compared to a warm summer day. With the density altitude at a
low level of around 500 feet, the air was relatively thick which increased the
air resistance. This mostly affected the trials of long hang time and
displacement since the ball was travelling through more air above the trees
where the winds were stronger. The pitching machine also posed a threat
to the accuracy of the experiment. The machine was very old and took
around 1-2 minutes to warm up to speed. The two wheels are also
independent of each other which could have resulted in a variation between
their speeds. The orientation of the ball as it entered the machine was
also very important due to the different spin that can be put on the ball as a
result. This machine did shoot knuckleballs (a pitch that minimizes the
spin on the ball), however, we tried to mitigate these errors by setting the
wheels to the same speed and monitoring the orientation of each ball as it
entered the machine. Due to the wet ground, we also used a new ball after
every eight to ten trials in order to keep the mass and smoothness consistent
between launches. Lastly, human error is inevitable, but we did our best
to eliminate it. The timing was not the most accurate due to three
averaged stopwatch times, however, we had a timer at
the machine, behind the machine, and in the field in order to get a broad range
of perspectives. As for the measurement system, it was difficult to walk
an optimal line to the ball due to the rough ground and the tendency to drift
to the side. Our marking system was also not the most accurate since we
had one person in the field marking where the ball landed with the naked
eye.
In
order to improve our research, a variety of strategies must be
implemented. The experiment should be performed in an indoor, controlled
environment to ensure consistent weather. A modern, precise,
multi-wheeled pitching machine must also be used to decrease the adverse spin
on the ball as well as accuracy. In an effort to decrease spin and drag,
a smooth, consistent ball with a more uniform composition such as a lacrosse
ball, should be used provided that it can properly function in the
machine. Lastly, the measuring system can be improved by using a digital
impact surface for marking the landing spot, lasers for timing, and precise
angle finders to ensure the proper initial angle of the machine. By
implementing these suggestions, both the accuracy and validity of this
experiment will be improved.
2017
Official Baseball Rules. 2017
Edition, Major League Baseball, 2017,
mlb.mlb.com/documents/0/4/0/224919040/2017_Official_Baseball_Rules_dbt69t59.pdf .
Collegiate
Baseball. “Grand
Master of Inventors.” Batting Practice for the Serious Ball Player,
Granada, 2004, battingpractice.com/history.htm.
“How Should You
Launch a Ball to Achieve the Greatest Distance?” Scientific American,
Springer Nature, 9 Nov. 2010, www.scientificamerican.com/article/football-projectile-motion/
Explanation
and validation of the distance formula for a projectile.
“Newton's
First Law.” The
Physics Classroom, www.physicsclassroom.com/class/newtlaws/Lesson-1/Newton-s-First-Law.
Explanation
of Newton’s First Law and how it applies to projectiles.
Official Playing Rules
Committee. “Official Baseball Rules.”
Stamp, Jimmy. “A Brief History of the Baseball.” Smithsonian.com,
Smithsonian Institution, 28 June 2013,
www.smithsonianmag.com/arts-culture/a-brief-history-of-the-baseball-3685086/.
Composition and
average mass/dimensions of a baseball.
http://www.humankinetics.com/excerpts/excerpts/magnus-effect-
Explanation
of the Magnus Effect and how the spin of a baseball affects its trajectory.
https://www.livestrong.com/article/351180-what-are-basketballs-made-out-of/
Analysis
of different baseball materials and their respective velocities when launched.