Power's effect on Lift-Time Experiment
Physics Internal Assessment
Britton Blanchard, Jarius Jackson & Jackson Willig
Background history of experiment .:. Statement of the Problem .:. Hypothesis .:. Lift-Time in
Experiment .:. Preliminary
Work .:. Experimental
Design .:. Gathering
Data .:. Close up
View of Graph .:. Half
Life Analysis .:. Uncertainty
of Data.:. Motor
Power Lift Limitations .:. Variables Limitaions .:. Conclusion
.:. GO UP
Background
history of experiment:
The first basic elevator dates back all the way to Rome 336 B.C. where a very rudimentary pulley system was used to lift the wooden cars, up. These manually powered elevators were powered by a man or animal, until they advance to using water wheels to power the lifts. The purpose of the elevators was used to move around things like water, and other heavy materials. In the 1800’s elevators became more popular for human use as buildings began to become several stories. It was in 1823 when two men, Burton and Horner invited and a steam powered elevator which they called, “The ascending room.” Around the same time people built hydraulic lifts, the issue with these where you had to dig a very deep hole in the ground underneath the elevator in order to push the pistons back to create enough power to send the elevator up. The steam powered cable elevators began malfunction and the cables would wear down and snap sending the elevator flying to the ground and killing people. The modern era elevator was invented in 1852 Elisha Otis, when he decided to add a safety brakes, so in the case of a cable snapping it would stop instead of plummeting to the ground. Elisha Otis showed off his invention in 1854 at the world fair when he went up in an elevator and cut the cables. The safety brake stopped the elevator and allowed for skyscrapers to build because reliable elevators had finally arrived. Based on the developments and history of elevators it intrigued us to wonder how fast and elevator can go with actually making a substantial change in lift-time.
Statement of
the Problem:
We will be determining how does a linear increase in power affect the lift-time of masses over a set distance?
Hypothesis:
If you increase the voltage of the produced by the generator then the power will increase causing the time for the weight to reach one meter to be faster, the time will begin to reach a set time, because amount of volts will only be able to affect the time so much through the distance of one meter.
Lift-Time
in Experiment
In this experiment we will determine how the power output will affect the lift time of a constant mass as it is lifted to a constant height. To determine the time and limit the uncertainty we will pause in between each trail to allow the string to stop shaking. The string will shake due to the fact that the power source is cut off once the mass reaches the set height of one meter causing the mass to immediately fall and begin to swing. The mass will be set back in its starting point but, the string will take a moment to stop moving. If we do not wait for the string to be still the mass will start to swing on its way up creating a greater distance traveled and will also affect the aerodynamics of the mass causing the time of lift to be larger and uncertain.
Preliminary
Work
Mass- The weights we could use with hooks (to tie to string) ranged from 50mg to 500mg. We decided after a few test that 200mg would be the best weight to use. Masses less than 200mg were to light and would have little effect on string causing the lift time to less affect by the change of power. If the mass surpassed 200mg it would take much more power to lift the weight and would put a great amount of tension on the string.
Lift Height- We timed how long the mass would take to reach a height of one meter. One meter was a large enough distance to get times and could easily be measured with a meter stick.
Power Source- For the power source we need something which would allow us to manipulate the power output. A variable filtered voltage generator, would allow us to change the voltages as well as immediately cut off the power source once the mass reached one meter. With two voltmeters we were able to find both the current and a precise voltage which would allow us to find power.
Time Measurement- For time measurement we used a simple stopwatch and the moment the generator was powered on we started the timer, once we saw the bottom of the weight pass the meter stick we would stop the timer.
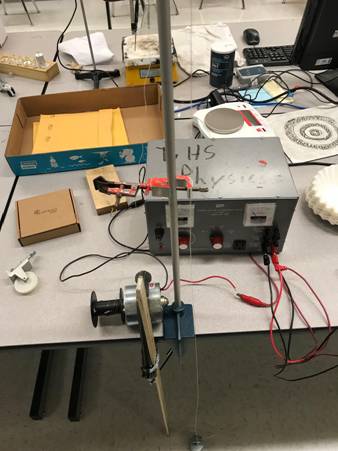
Experimental
Design
This experiment was used further analyze our hypothesis that the power output on of a lift would produce result time of exponential decay. We used a pulley system to lift a constant mass (200mg) one meter, changing the power output of a generator to affect the time it would take the mass to reach one meter. There is such a short distance to be covered so as the speed increases linearly over our trails there will be limited distance for the higher speeds to make a significant difference. With taking multiple trials of multiple different voltages we should be able to determine the pattern of exponential decay.
Gathering Data
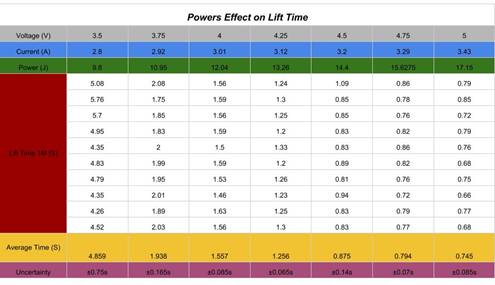
The time in our data was recorded with a stopwatch as we took ten trials of
seven different voltages ranging from to 3.5V to 5.0V to calculate and
multiplied by the current to find the power that was used to lift the weight.
The weight we used was a 200 mg iron weight. The reason for choosing this was
so the wire did not snap at high power. While recording the data, we
encountered a few mishaps where we did not start the stopwatch, or we had not
begun to record the voltage. A few test trials were done with each voltage so
as to be as accurate as possible when it came time to getting the real data.
Although, with more trials our model and graph would have been more accurate
and more appealing to the eye, but with the data we recorded it is still
fitting to how our experiment should have gone.
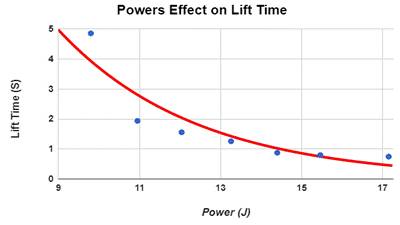
Close-Up
View of Graph
This close-up of our graph clearly shows an exponential decay of
time as the power of our machine increased. It was near impossible to find an exact
equation for what occurred, but this graph has an very
well interpreted exponential decay line.
Here’s a video of how we collected our numbers: https://youtu.be/tt6aXsY8E_M
Half Life
Analysis
We collected data and made the conversion of Current multiplied by Voltage to get Power. We found when we put our data in a graph with seconds on the y axis and power on the x axis like the graph above, we realized that the graph is similar to a half life graph . So this graph is shown that with more power, lift time decreases. And the resulting data is parallel to a half life graph. We determined that our half life constant based off of our gradient of our graph would be would be approximately, -.5597.
Uncertainty
in data
Overall we calculated the uncertainty of time to be about +/- .196 per trial; however, there were a few outlier results that skewed the overall timing. The timing was done by hand, which only increases the room for human error. Though human error may have occurred, the data was done to the best of our abilities. To calculate our uncertainty of time, we took the range of each variable’s time, and divided it by two. Lastly, we then took the average of all the uncertainties.
Motor
powered lift limitations
Based on our motor and weight it would take exactly three and a half volts to move the 200 gram weight off the ground in a linear fashion. This is due to the heavy weight and gravity pulling on the string, the motor needs to pull up more than 1,962 Newtons to get the weight moving up. When it comes to moving all this weight the amount of heat that gets produced by the motor can get high, and this is something to consider when looking at efficiency or distribution of work.
Variables
limitations
The way we collected data was as simple as turning on our energy output to a certain amount of volts and timing the weight moving up a meter. The weight which was attached to a string that was pulled by our motor stayed constant.
The independent variable is the power output of our motor, we manipulated this by turning turning up the voltage by a mere ¼ a volt every ten trials. The voltage was easily measured by the energy output itself. While measuring the amount of volts was easy it wasn't read very well because of mechanical error, so there is a uncertainty of about .02 volts in our observation. We then used a voltmeter to measure the current of the energy output. Then with the voltage and current we used the formula, P=IV, to calculate the power.
The dependent variable is the time it took the weight to move a whole meter, from the ground all the way to the top of the meter stick we had to measure said distance. The dependent variable was easily found by using a stopwatch. Started when the weight starts movin up . There is some uncertainty of the time keepers reaction time which we calculated it to be .194 seconds.
The controlled variables include using the same weight which is 200 grams verified by a few balance scales to ensure accuracy, and also using the same person to time in hopes of their reaction time being the same every time so uncertainty is consistent. While among those listed the other things that were controlled were the energy output and its meters, distance covered by the weight, and motor used.
Four Experimental Assumptions
- The evidence from the exponential
decay suggests that the power and speed of an elevator increases, the
faster it will raise until it eventually levels
out. This is demonstrated in our graph. It is mathematically correct that
at some point the power would level off.
- The value of gravity pushing
against our weight will be assumed, since it is a constant.
- The distance the weight goes
each time upward is the same each time so we can try to stop the watch at
the same height every time.
- The last assumption we will
make is that the voltage and current remain the same through each
individual variable. This will make it easier to calculate power because
trying to find the exact voltage each trial would be incredibly difficult
to do without better equipment.
CONCLUSION
We proved our hypothesis to be correct, we increased the voltage with the use of the generator and in doing so the power increased directly causing the time for the weight to reach one meter to be faster. Coincidently the time began to reach a set time, because the amount of volts was only able to affect the time so much through the distance of one meter before the mechanism would break due to the weight being thrown around by the motor. Our graph and data proved our hypothesis, the graph showed close correlation with a half life graph which levels off at a certain point due to an asymptote.
A limitation to our experiment would be the amount of trials to do with higher voltages. This is because at the higher voltages the generator would produce enough energy for the motor to have the ability to throw around the weight and the data would be slightly incorrect due extra unneeded movement.
An advantage to changing the weight would be to get more data and add to the graph. With repeated trial at a higher weight we would have the ability to continually prove our hypothesis. To fix this we could change the weight in the beginning, to around 350 grams or so and continue to do our research and see if we get the same results.
An application to the real world with the data we have found would be using elevator energy efficiency. An engineer would use our half life constant and find the correlation between weight and power needed to lift such tonnage. Then the engineer would put that equation into a computer attached to the elevator that would send the weight back to the computer and the computer would calculate how much power it would need to do to bring the people or items in the elevator to the proceeding floors at a safe speed, with energy efficiency.
Overall, we were surprised to see how well our data coincided with a half life graph but we are excited that we found out a potential way to save companies and buildings thousands in energy bills with our efficiency application.
Related Websites:
GO UP
https://gizmodo.com/who-invented-the-elevator-1570745196
The elevator has been around for over 2000 years, and even though it has not always been electrical or mechanical, it worked nonetheless.
http://www.elevatorhistory.net/elevator-inventor/
The modern elevators popularity skyrocketed around 1860.
www.explainthatstuff.com/how-elevators-work.html
The
pulling force of gravity is converted to kinetic energy once the elevator is in
motion.
https://www.quora.com/Energy-Consumption-How-much-power-does-a-normal-elevator-consume
Elevators are used worldwide, although not every elevator is the same
https://www.elevators.com/types-elevators-used/
The elevator has evolved drastically since the beginning of their creation, and today’s elevators are the most efficient they have ever been.