The Effect of Angle (º)(+/-0.5º) on Force (N)(+/-0.002 N) When Acted Upon by a Constant Wind
Ellie Parker
Table of Contents
Laminar flow is a type of fluid flow, either gas or liquid, that travels in regular paths. It usually occurs at lower velocities, as it turns to turbulent flow as speed picks up. When thinking of laminar flow over a surface, consider many thin layers of the liquid, all moving at once. The surface itself is stationary, yet all the other layers are sliding over each other (Encyclopedia Britannica Online).
Laminar air flow is important in the world of aerospace, because as the wind hits a wing, the bottom side has a laminar flow and the top side has a turbulent flow. This is possible due to the shape of the wing which is called an airfoil. At one point, there was an attempt to make a wing with complete laminar flow, and with this idea of complete laminar flow in mind, an airfoil that was symmetrical with equal curvature was created. One of the most famous aircraft sporting this type of airfoil is the P-51 Mustang. The airfoil, while seemingly brilliant in design, required exceedingly exact measurements, and was quickly shelved by most other manufacturers (Aviation History Online Museum).
The part-laminar and part-turbulent airfoil creates a pressure difference, which then produces lift. As noted in Bernoulli’s principle, he states that an increase in the speed of a fluid produces a decrease in pressure, and that a decrease in the speed of a fluid produces an increase in pressure. This means that the total energy of a moving fluid remains constant at all times. Therefore, fluid pressure is inversely proportional to fluid velocity (Bernoulli, 1968). Effectively, the wing is pushing air down, so as this occurs, the air pushes the wing up, making flight possible.
This distribution of pressure resulting in lift on an airfoil is affected by the angle of attack. The angle of attack is the angle between the oncoming air or relative wind and a reference line on the airplane or wing (Federal Aviation Administration, 2015). As wind hits the wing, depending on the angle of attack, a different amount of force is produced which causes the airfoil to produce more or less lift.As the angle of attack increases, so does the amount of positive pressure, which allows the airplane to climb. As the angle of attack decreases, so does the amount of negative pressure, which allows the plane to descend.
The purpose of this investigation is to determine how the angle of an object in relation to the relative wind affects the force created by a flow of laminar air.
Hypothesis .:. Top
If the angle of attack (degrees) of the object is increased, the force created by the flow of laminar air will then in turn increase (with the angle as the independent variable and the range as the dependent variable) up and to a point because of the increase in contact with the air flow, as well as the proximity change of the object.
Materials
● Air blower with attachable hose
● 30 plastic drinking straws
● Cardboard Box with attached lid
● Triple Beam Balance
● Protractor
● Duct Tape
● Masking Tape
● Books or box (to rest hose on)
Procedure .:. Top
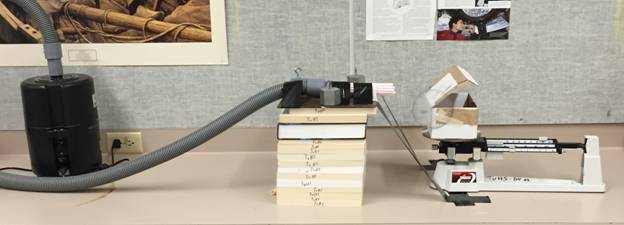
First, insert as many straws as possible into air blower hose and secure with tape. Then, tape box onto triple beam balance scale, with the top of the lid facing the blower when lifted up. Using books or a box, secure the hose with tape facing towards to box so that the straws hit about the middle of the lid. Once the hose is secured, tape the lid flat so that the protractor shows an angle of 0º. Turn on the blower and measure the weight increase (or a decrease, simply note it as negative). Record your findings in a table. Turn off the blower for at least 5 seconds, then turn it back on and re-measure, until you have completed a total of five trials.
Repeat the trials for angles measuring 10º, 20º, 30º, 40º, 50º, 60º, 70º, 80º, and 90º.
In this experiment, a cardboard box with a hinged lid was secured to a triple beam balance. A blower with its wind speed set at a constant was then aimed at this flap and also secured, as to prevent movement and any skewed results. The blower pipe was filled with straws to ensure laminar airflow onto the box lid. The initial weight of the box, 93.3g, was factored out of the weight that the wind caused. A circular protractor was taped onto the box, and the lid was secured with tape at every angle.
For each trial, the angle will be set, and then the blower will be turned on. The wind speed will never be adjusted, just the on/off switch. Between each trial at one angle, the blower will be turned off and after the scale has settled, will be turned back on and remeasured to see if the weight needed to balance the box has shifted in any way.
After five trials at 10 different angles have been taken, the five trials for each angle will be averaged and then converted to force, by taking the average (in grams) and dividing it by 1000 in order to get kilograms, and then multiplying it by earth’s gravitational constant of 9.81 in order to get force (N).
Raw and Processed Data .:. Top
Data Table 1:
The raw data was collected and the results were then computed in order to find averages for each of the data points.
Data File: Data.:,
Data Table 2:
This data table shows the averages of all of the tests, still
in grams, and it can be noted that the force seems to peak at about 50º before
decreasing once the test is set to 60º. The data was then converted to Newtons with a simple equation. ![]()
Data Table 3:
The standard deviation was calculated using the formula ![]()
The standard error of the mean is the standard deviation multiplied by the square root of the sample size, which is 5 in this case. The 95% confidence interval, which is the choice for displaying error bars on the graph, is computed by multiplying the SEM by a t-test constant of 2.312.
The graph mirrored exactly what was predicted in the hypothesis. The force created increased up and to a point and then it began decreasing again as the angle continued to increase. The initial force at 0º was negative, there was actually lift produced from the box when the wind was blown over it, due to the Bernoulli principle, but as the lid was raised and the wind encountered an obstacle, force was indeed created. The peak of force was at 50º, and it created 0.071 N. This force also had no error bars, because all five tests measured the same. The other tests had significantly large error bars as is shown on the graph, and in the data. The 10º error bars of 0.117 N on either side, showing that 95% of data would fall in this range, but seeing as the range is so large, it instills a feeling of doubt into the data, even though the hypothesis was proven correct. The graph resembled a parabolic curve.
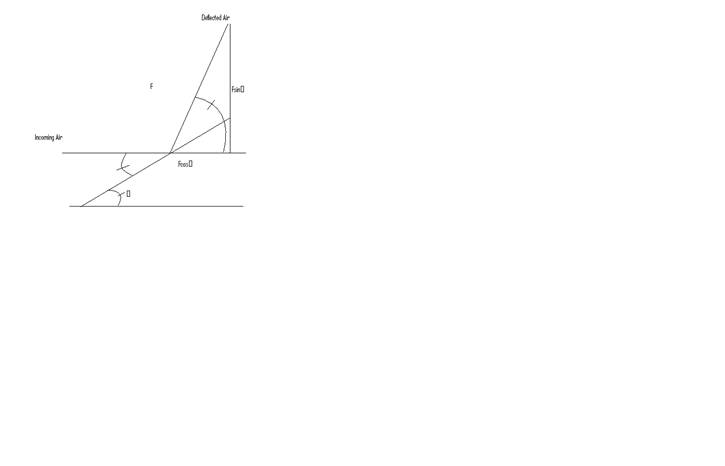
If θ=30º the air is deflected upwards at 60º. For any angle other than 45º, the air is deflected upwards at some sort of angle that causes it to deflect to the side instead of straight up, so the optimal angle is 45º because that would ensure that the air is deflected straight upwards. As the graph showed, the greatest force was exerted in the 40º-50º range, supporting this idea.
This experiment encountered a few limitations, one of them being that the windspeed was never changed, so it cannot be determined if the force increases and decreases would have occurred at the same rate if the wind had been faster or slower. The windspeed was also unknown, simply set as a constant, which adds another factor of limitation to this data. An issue that may have caused skewed results in the data was that the straws, while aiming the air in the same spot every time hit the box lid in a different spot every test due to the angle change. This could have affected the force created by the wind, and therefore severely altering the results.
Barton, Marilyn L. "Laminar Flow." Encyclopedia Britannica Online. Encyclopedia Britannica,
9 Apr. 2014. Web. 30 Nov. 2015.
Bernoulli, Daniel, and Jean Bernoulli. Hydrodynamics. New York: Dover Publications, 1968.
Print.
"Federal Aviation Administration." Federal Aviation Administration. N.p., n.d. Web. 30 Nov.
2015.
"Laminar Flow Airfoil." The Aviation History Online Museum. N.p., n.d. Web. 30 Nov. 2015.
Related Websites .:. Top
http://hyperphysics.phy-astr.gsu.edu/hbase/pber.html
Explains Bernoulli’s Principle with application to physics
http://ntrs.nasa.gov/archive/nasa/casi.ntrs.nasa.gov/20100030606.pdf
A NASA study that explores some similar themes much more in depth
https://www.aircraftspruce.com/catalog/pdf/13-08723.pdf
A textbook chapter about airflow
http://science.howstuffworks.com/transport/flight/modern/airplanes.htm
A real life application of aircraft and how they work in relation to this study
http://www.explainthatstuff.com/aerodynamics.html
Explains air flow and aerodynamics