Transformers:
Effect of Turns on Efficiency
Caitlin Bingham 2016
Table of Contents
The power grid is one of the most influential systems that is used in everyday life, but it is also the most taken for granted. Power is always at our fingertips; we hardly realize how much we depend on it until it’s lost, such as in a power outage. The power grid takes electricity generated at power plants and distributes it to every building and household (Brain). The buzzing noise you hear when you walk by power lines is because of the high voltage in the lines. Unfortunately, the electricity that travels down the power lines loses some of its energy because it has to travel so far. To combat this resistance, transformers are used to “step-up” and “step-down” voltage (“How Does”). Higher voltage means lower current and less power lost due to resistance of the wires - VI = Power (Watts) V=IR where V is voltage, I is current, and R is resistance. The step-up transformer increases the voltage as it leaves the power plant, making it more efficient. When the electricity comes into a house, a step-down transformer is used to convert the voltage down to safer levels (Woodford).
A transformer is a device that changes one voltage to another through a turns ratio, but it the amount of power remains the same. In a transformer, coils of copper wire (inductors) are wrapped around a “core,” which is typically made of silicon steel, ferrite, or some other kind of ferrous material. Turns refers to how many times the wire is wrapped around the core. The turns ratio is a ratio comparing the number of turns from the primary (input coil) to the secondary (output coil) (Kuphaldt). If the primary has more turns than the secondary, then the voltage is being decreased. On the other hand, if the primary has less turns than the secondary, the voltage is being increased. Transformers increase the voltage, which decrease the current (“Electrical”). Resistance affects current more than voltage, so when the current is less, you won’t lose as much power.
A signal source can be used to put power into the primary, where the magnetic field is generated. The wire is wrapped around the core in coils because it creates a stronger magnetic field and it increases the magnetic flux. The core material helps to couple the two coils through the magnetic field. Since the secondary is connected to the primary which is generating the magnetic field, the secondary can use that energy to generate a voltage on the other side.
Statement of the Problem To Top
The purpose of this investigation is to find out how transformers work, specifically discovering the effects of the number of turns on efficiency.
Hypothesis To Top
Having more turns will create more magnetic flux, which generates more power. I believe that, with a constant 1:1 ratio, having more turns around the core will make the transformer more efficient. Efficiency is defined as the amount of output power divided by the input. The number of turns is defined as how many times the coil is wrapped around one side of the transformer. The controlled variables include, but are not limited to, the turns of the coils, the material of the transformer’s core, the ratio of turns, the wire used in the coils, and the frequency of the signal source.
Method To Top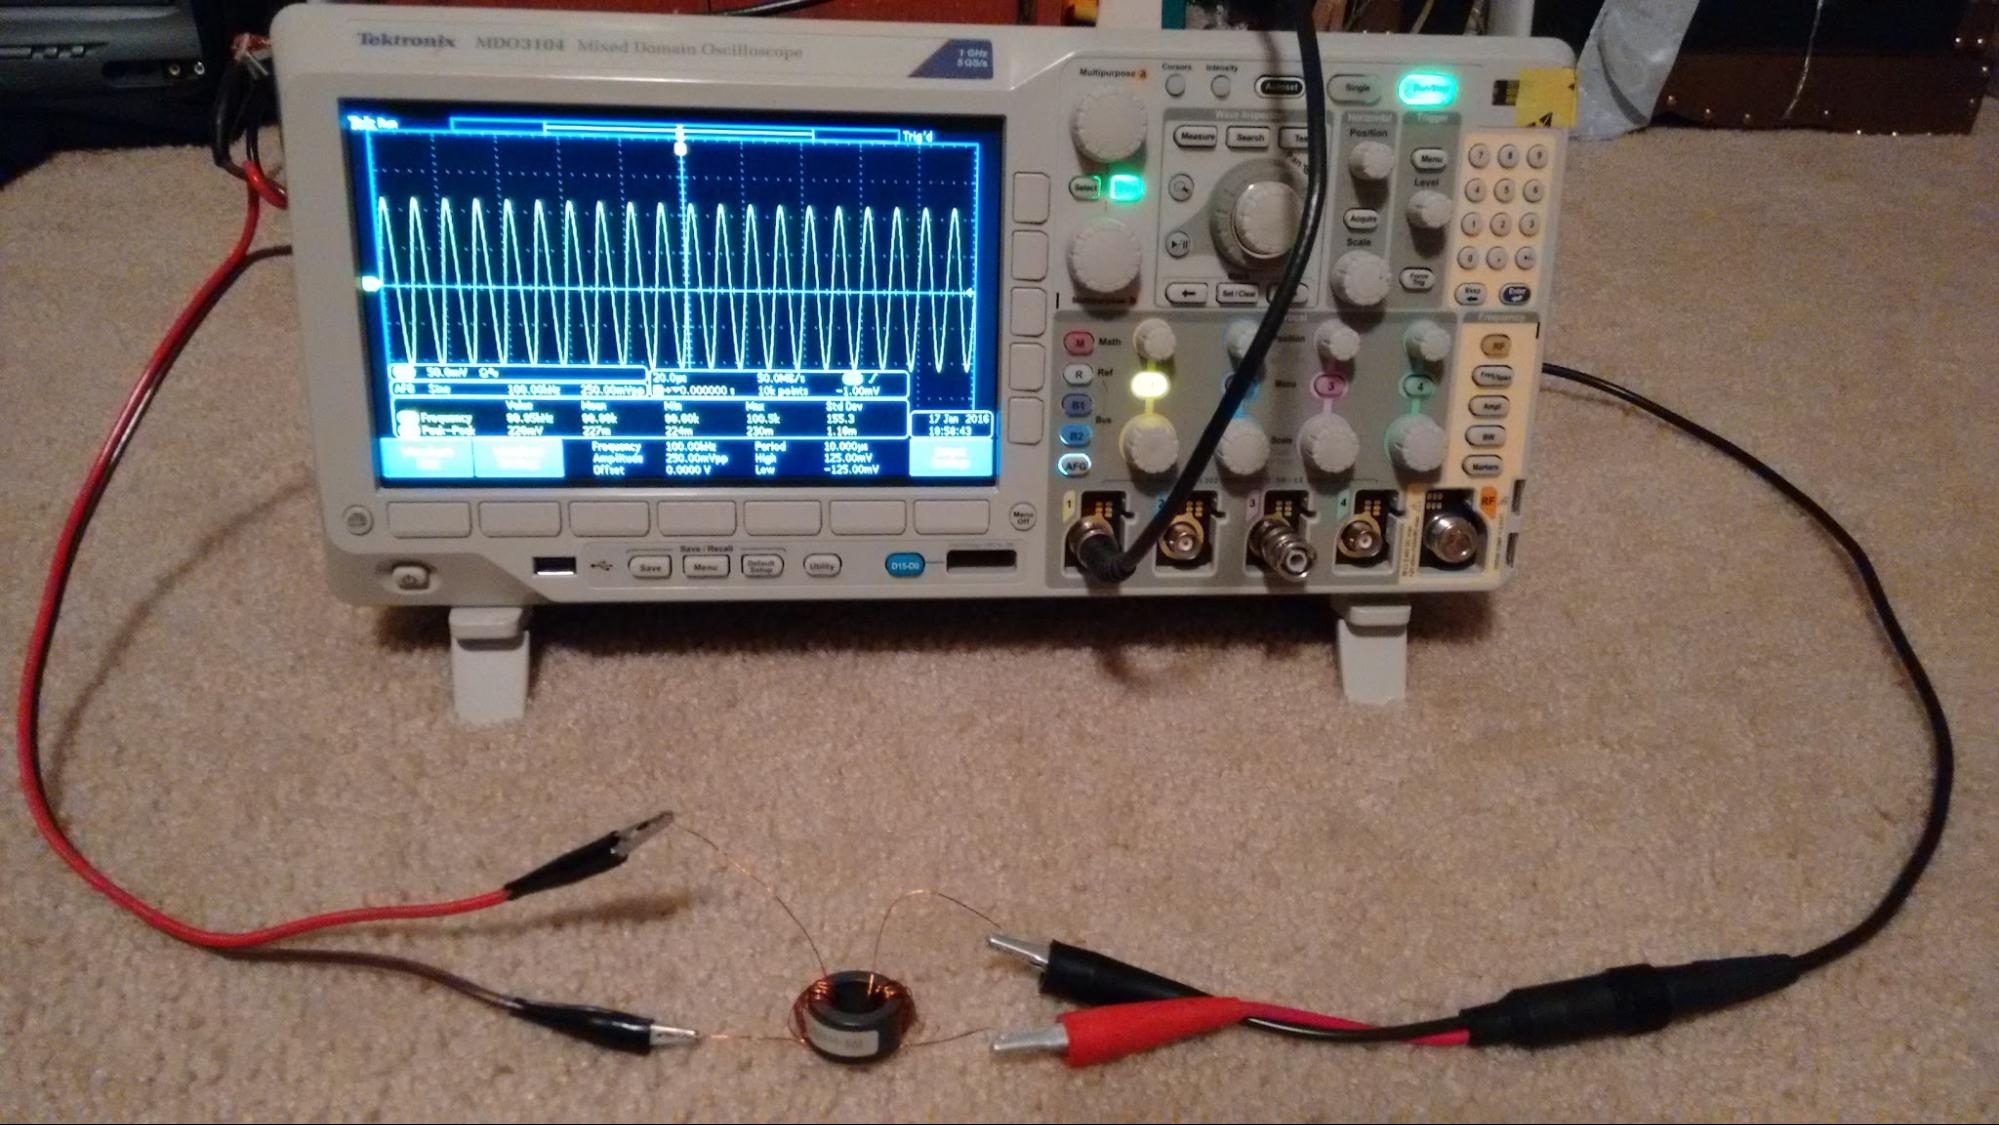
For this experiment, I used a torroid core, two pieces of copper wire with protective coating, alligator wires, and an oscilloscope (Tektronix MDO3104).
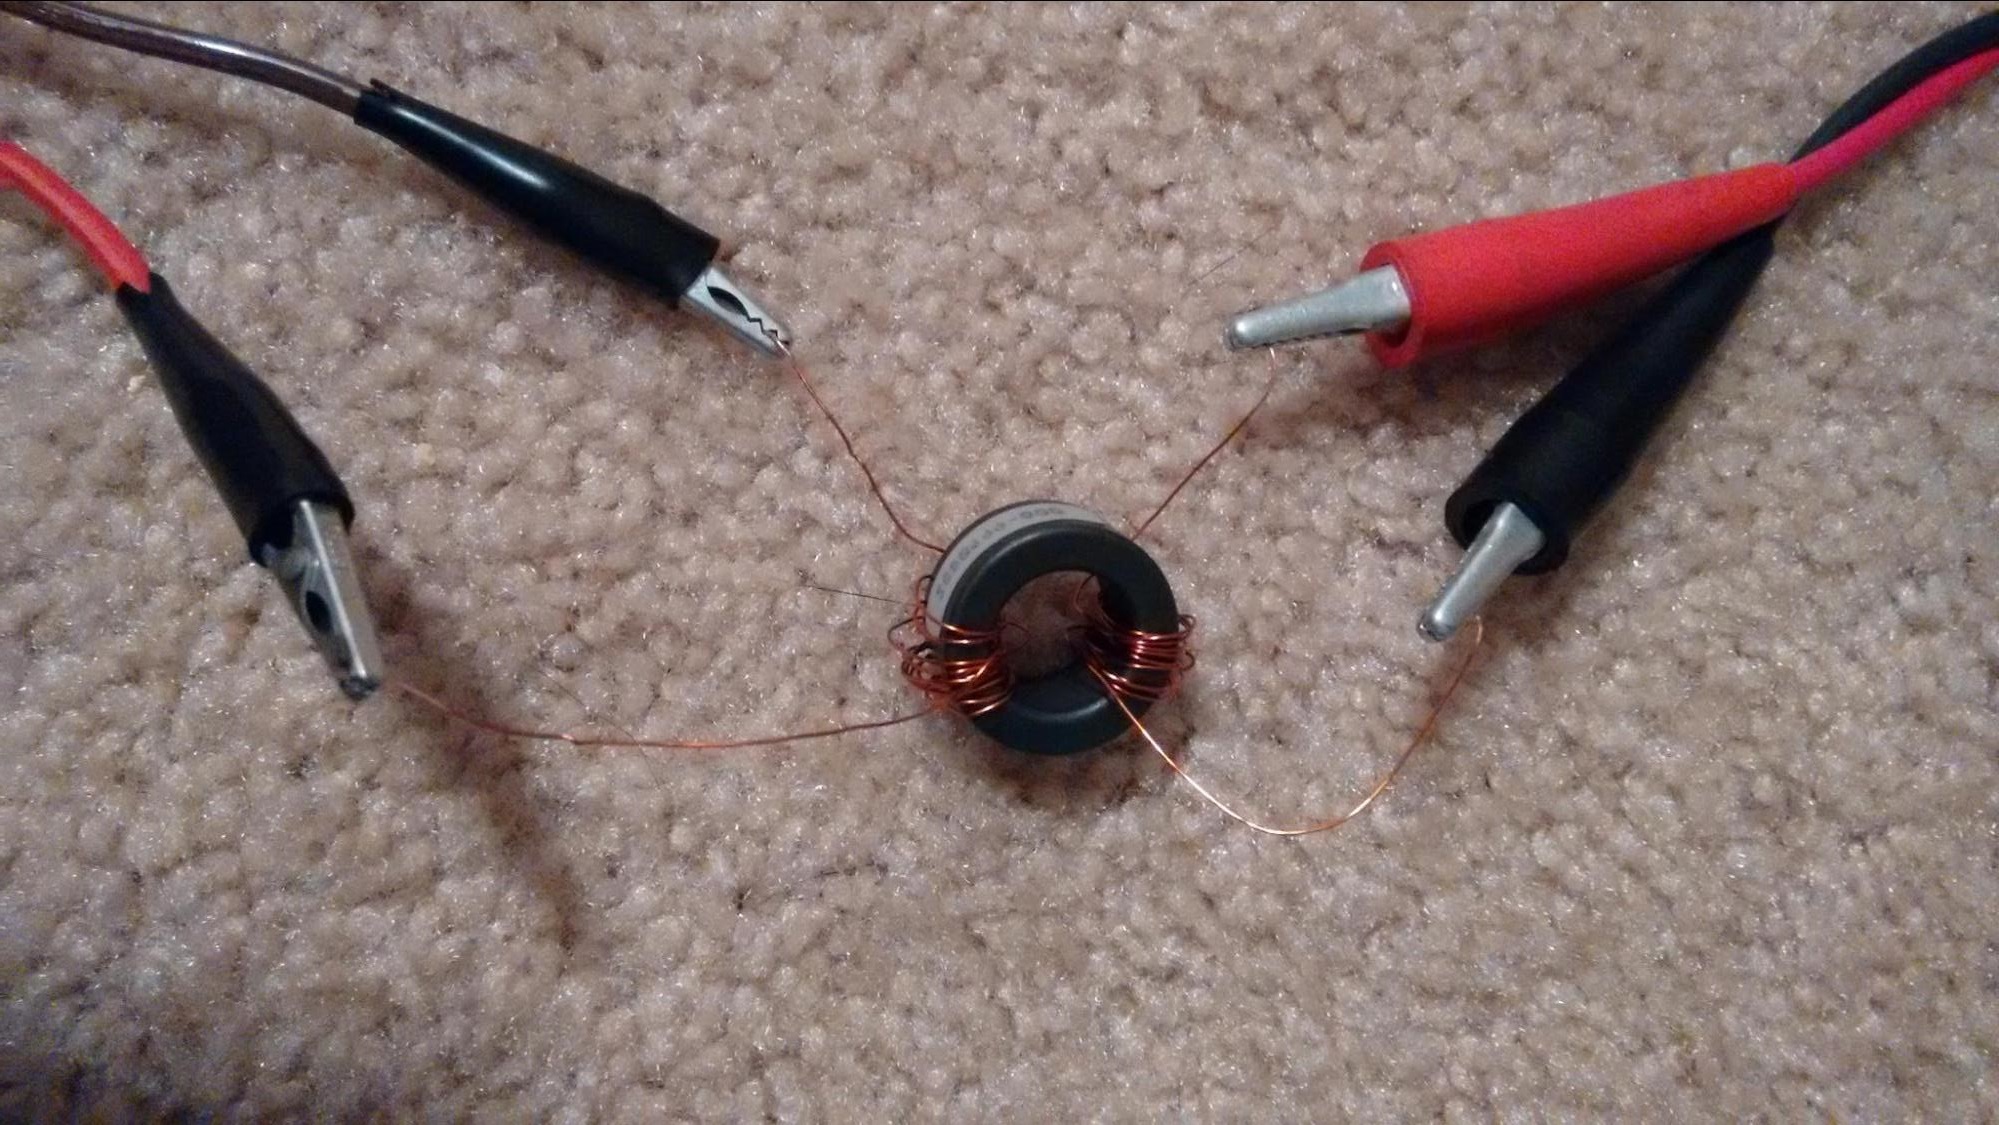
Before I set up for the experiment, I plugged the signal source directly into the channel of the oscilloscope and measured the source to be a voltage of 261 mV. Low voltages were used to ensure the safety of myself and the environment. For the experiment, I connected the first set of alligator wires to the signal generator of the oscilloscope (50 Ω) (pictured right).The second set was connected to the oscilloscope’s channel (left of picture). I used the settings on the oscilloscope to put a 50 Ω load on the output. For each turn, I wrapped one copper wire on each side of the toroid. One turn is one full loop around the core. To obtain data I connected the alligator wires to the ends of the copper wire, where I had scratched off the protective coating, as shown below.
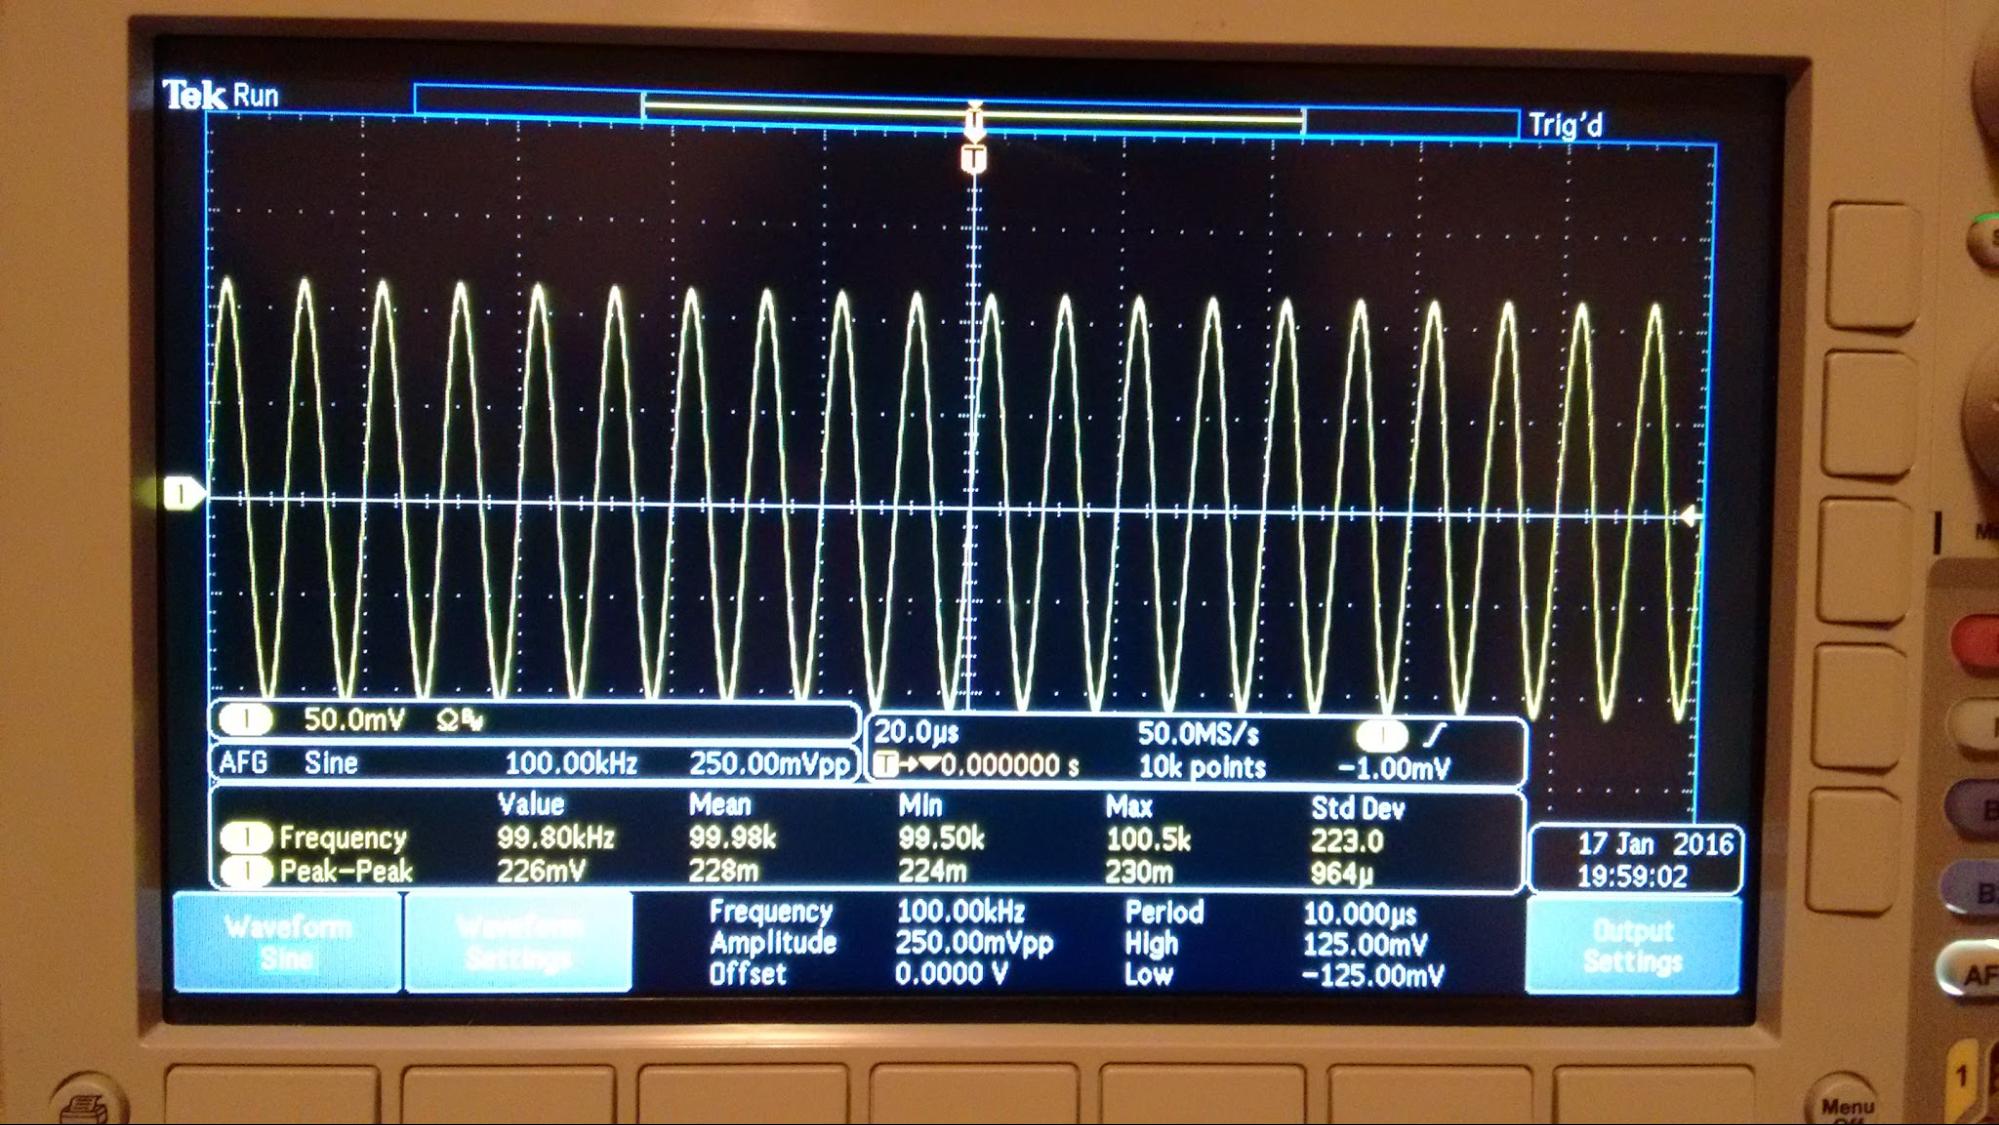
I recorded the mean peak-peak voltage from the oscilloscope’s screen as shown below. The screen also shows the 50 Ω load, the 100 kHz frequency sine wave, and it is an example of one trial of ten turns.
I took
four trials of each number
of turns. I used 100 kHz as the
frequency because that is what best fits with the equipment
that I am using.
Data Collection To Top
|
Number of Turns |
Trial 1 (mV) |
Trial 2 (mV) |
Trial 3 (mV) |
Trial 4 (mV) |
Average (mV) |
Uncertainty +/- |
Efficiency |
|
1 |
20.6 |
20.7 |
20.7 |
20.8 |
20.7 |
.05 |
7.93% |
|
2 |
43.6 |
43.6 |
43.6 |
43.6 |
43.6 |
0.0 |
16.7% |
|
3 |
73.6 |
73.5 |
73.4 |
73.7 |
73.6 |
.15 |
28.20% |
|
4 |
107 |
106 |
106 |
109 |
107 |
1.5 |
41.0% |
|
5 |
142 |
141 |
142 |
140 |
141 |
1.0 |
54.0% |
|
6 |
169 |
170 |
169 |
169 |
169 |
.50 |
64.8% |
|
7 |
191 |
190 |
190 |
191 |
191 |
.50 |
73.2% |
|
8 |
206 |
206 |
206 |
206 |
206 |
0.0 |
78.9% |
|
9 |
218 |
218 |
221 |
217 |
219 |
2.0 |
83.9% |
|
10 |
226 |
226 |
229 |
230 |
228 |
2.0 |
87.4% |
To calculate the uncertainty I used the equation (Range) / 2, where the range is the lowest value subtracted from the highest value out of the 4 trials
To calculate the efficiency I divided the average voltage (output) by 261 mV (input). If the transformer was 100% efficient, then I would get 1 when I divided. For the table I changed the decimals into percentages.
Figure 1 To Top
As demonstrated by the graph, as the number of turns increases, the average peak-peak voltage also increases. Uncertainty bars are also graphed on the curve.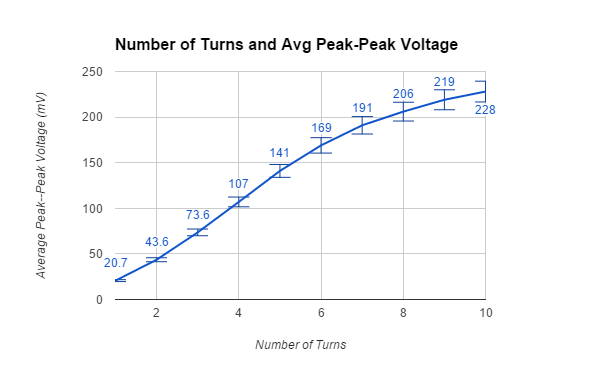
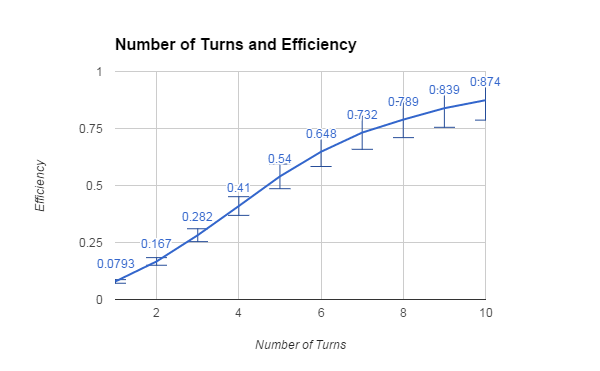
Figure 2
The next graph illustrates that the efficiency varies directly with the average peak-peak voltage. As the number of turns increases, so does the efficiency. Error bars are graphed for the efficiency.
Conclusion/Analysis To Top
The data from my experiment supports my hypothesis. I predicted that more turns on the transformer would make it more efficient. The experiment showed that more turns increased the output voltage which made it more efficient. Fewer than 5 turns do not couple enough energy into the core, thus leading to less than 50% efficiency. To maximize the efficiency, the number of turns would need to be more than 10. If the number of turns were to be increased beyond those of the experiment, the efficiency graph would be asymptotic to a line just less than 1.
Sources of error include, but are not limited to, the nearness of the wires, how tight the coils are wrapped around the core, the inaccuracy of the equipment, and noise. Throughout the experiment, the copper wires were not consistent distances from each other. To reduce this error, one could make a fixture to hold the lead wires in fixed positions. The tightness of the coils on the core varied; the tighter the coils are the stronger the magnetic field which gives a higher voltage output. I measured the signal source’s voltage directly in order to try and minimize any error in the oscilloscope’s channel and source, but there’s still error. Electrical equipment, such as the oscilloscope, always has noise. In addition, the frequency was low to help keep the errors from having too much influence.
As an extension of this experiment, I think it would be interesting to see the effect that changing the frequency has on the efficiency curve. Currently, a specific number of turns has a certain efficiency. The frequency will change the number of turns required for that efficiency. Would increasing the frequency mean you need more turns on the core? Or less turns? What about decreasing the frequency? Another possible extension of this experiment would be seeing where the efficiency improvements become insignificant. This would help in a real world scenario where someone wanted to maximize the efficiency of the transformer and minimize the amount of coil needed.
Bibliography To Top
http://www.science.smith.edu/~jcardell/Courses/EGR220/ElecPwr_HSW.html – This website has a nice diagram of how power goes from the power plant to our homes. It also contains pictures of actual transformers used in the power grid.
http://www.electrical4u.com/electrical-power-transformer-definition-and-types-of-transformer/ - This site explains what a transformer is, what it is used for, the different types of transformers, and more!
http://energyquest.ca.gov/how_it_works/transformer.html – Energyquest gives a brief and simple explanation of how a transformer works.
http://www.allaboutcircuits.com/textbook/alternating-current/chpt-9/step-up-and-step-down-transformers/ - This chapter from a textbook talks about step-up and step-down transformers and how primary/secondary windings are used to 'step-up' and 'step-down' voltages.
http://www.explainthatstuff.com/powerplants.html – This site also explains how energy gets from the power plant to your house.