

Tualatin High School Physics
|
|
Physics Research Project |


|
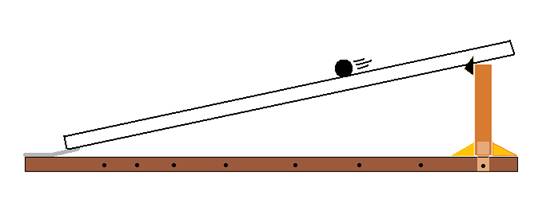
Realistically, the necessary background information on the affect of a change in incline on the velocity of a rolling object is quite easy to derive on your own. There is no need to look into some ridiculous articles full of big scientific words and lengthy equations. Anyone who has simply driven a car, ridden a bike, or even lost a ball down a hill knows enough background information to whet the appetite of knowledge needed understand the essentials of my research project. It is obvious to any normal, fun-seeking, and slightly daring child (current or past) that there is far more enjoyment to be had at the steepest of hills around town rather than those your parents insist you ride safely on. Why? It’s because you go way faster! Not only does the wind in your hair satisfy the hunt for fun and satisfaction, but the risk of falling at high speeds gives the adrenaline rush to leave any child worn out after a certain number of trials. Although there is the common knowledge of, “The steeper the hill, the faster the ride,” there doesn’t seem to be a well known answer to the question, “How much faster?” This is the question that birthed my research project plan. The purpose of my investigation is to determine the effect that the angle of an inclined plane has on the velocity of a rolling object. The dependent variable within this experiment is the velocity, and the independent variable that I will be manipulating is the angle of the plane. My hypothesis is pretty simple. If the angle of a plane increases at a constant rate then the average velocity of an object will also increase at a constant rate, because the velocity varies directly to the incline of the plane. Once again, the dependent variable is the velocity and the independent is the incline angle. In order to have the least amount of change from trial to trial, I have come up with a setup that will minimize the possibilities for errors. I have decided to make a one size fits all method for my setup. I attached a four foot long plastic track to a four and a half foot long piece of wood by a hinge on one side; while the other side of the track moves up and down freely. This allows for easy adjustments. To hold the plastic track in place of the various different angles, I built a wooden support that slides along the base piece where it can be locked into place at the different marked angles. To ensure the tracks stability, I included pieces at the top of the sliding support that would hold it in place at every angle.
Using the same materials on each angle and trial made for a lessening of outside factors that could potentially change or skew the final data and results. To gather my data I used a pool ball as my rolling object. At the top of my apparatus I placed a backboard of sorts that the ball was to be pushed up to and released. Upon release of the ball at the top, a stopwatch begins timing. Once the pool ball had traveled the distance and crossed the marked finish line, time would be stopped and recorded. This process would be repeated a minimum of ten times per angle. The angles that I tested were 20, 30, 40, 45, 50, and 60. Once the ten data points were gathered at each angle, I would find the average length of time the ball would take to roll down the plane at each specific angle. Once the average time was recorded, the real physics could start being calculated. My original plan was to test and hopefully discover trends with just the average velocity of the ball in comparison to the angle, but I decided to take it a step further and measure trends in all the aspects of velocity. To do so, I first broke the displacement of the plastic track (1.2192 m) into vector components. Using the laws of Sine and Cosine I could find how much of the total displacement was either horizontal or vertical. Once I had broken it into vectors, it was a simple “SUVAT” equation that would give me the final velocities. I used the formula, V^2= U^2 + 2as, to find the vector components final velocities horizontally and vertically, as well as combining the two to get the overall final velocity of the ball. Once I had gathered the more specific data, I was able to calculate the average velocity of the ball for each angle by dividing distance by time. To break the average velocity into components I used the laws of sine and cosine again. Taking the project to the next level and breaking it into vectors and using averages gave me a lot more data that could help further my knowledge of the growth rate of velocity in relation to the angle. The results of my experiment turned out to be far more informative than I would’ve anticipated. I was able to clearly see the inverse variation and relationship between the horizontal and vertical final velocity. The graph demonstrates an almost perfectly inverse relationship of the two values. In addition to a graph of the final vertical and horizontal velocities, I created an average velocity comparison graph. In this graph you can see that the average horizontal velocity is showing signs of a parabolic function. While the slope is at a lower angle it has a slower horizontal velocity, but reaches its peak at a forty five degree incline. Once it passes its peak it begins to drop again. When the incline is over forty five degrees most of the ball’s velocity is going to be in the vertical direction rather than horizontal, causing it to decrease. You can also see the beginnings of an exponential growth in the vertical velocity. This is a great demonstration of the exponential nature of both horizontal and vertical velocity in terms of the angle of incline. My final graph showed the increase of the final velocity and average velocity from one angle to the next. This is what I wanted to know all about from the beginning. In the case of both the average and final velocities, the increase is exponential. From one angle to the next the velocity increases more and more than the time before. My results showed convincing trends in many cases, however, throughout the experimental process there were many different things that may have caused uncertainty with the data. Anytime you rely on a human source to do any kind of timing, uncertainty and errors are inevitable. I recorded a number of outliers during my time trials and simply threw them out. Yes, that is somewhat manipulative and arbitrary, but they seemed very obviously irrelevant to me. Despite the fact that logic tells me I was right, simply throwing out collected data can definitely cause a change in the outcome of an experiment. Second to the timing errors would be angle measurement. I used a simple protractor to mark the angles on my setup, but it was not a flat surface I could measure as easily as a picture on piece of paper. Going through the tests over and over, I also came to realize that there was a slight flex in the body of my plastic track. This is yet another hit to the measurement of my angles. Although there was error and possible manipulation, I feel my results have shed light on the problem at hand. |
|
VELOCITY & INCLINE Levi Levasa |
|
20 25 30 35 40 45 50 55 60 |
|
20 30 40 50 60 |
|
Realistically, the necessary background information on the affect of a change in incline on the velocity of a rolling object is quite easy to derive on your own. There is no need to look into some ridiculous articles full of big scientific words and lengthy equations. Anyone who has simply driven a car, ridden a bike, or even lost a ball down a hill knows enough background information to whet the appetite of knowledge needed understand the essentials of my research project. It is obvious to any normal, fun-seeking, and slightly daring child (current or past) that there is far more enjoyment to be had at the steepest of hills around town rather than those your parents insist you ride safely on. Why? It’s because you go way faster! Not only does the wind in your hair satisfy the hunt for fun and satisfaction, but the risk of falling at high speeds gives the adrenaline rush to leave any child worn out after a certain number of trials. Although there is the common knowledge of, “The steeper the hill, the faster the ride,” there doesn’t seem to be a well known answer to the question, “How much faster?” This is the question that birthed my research project plan. The purpose of my investigation is to determine the effect that the angle of an inclined plane has on the velocity of a rolling object. The dependent variable within this experiment is the velocity, and the independent variable that I will be manipulating is the angle of the plane. My hypothesis is pretty simple. If the angle of a plane increases at a constant rate then the average velocity of an object will also increase at a constant rate, because the velocity varies directly to the incline of the plane. Once again, the dependent variable is the velocity and the independent is the incline angle. In order to have the least amount of change from trial to trial, I have come up with a setup that will minimize the possibilities for errors. I have decided to make a one size fits all method for my setup. I attached a four foot long plastic track to a four and a half foot long piece of wood by a hinge on one side; while the other side of the track moves up and down freely. This allows for easy adjustments. To hold the plastic track in place of the various different angles, I built a wooden support that slides along the base piece where it can be locked into place at the different marked angles. To ensure the tracks stability, I included pieces at the top of the sliding support that would hold it in place at every angle.
Using the same materials on each angle and trial made for a lessening of outside factors that could potentially change or skew the final data and results. To gather my data I used a pool ball as my rolling object. At the top of my apparatus I placed a backboard of sorts that the ball was to be pushed up to and released. Upon release of the ball at the top, a stopwatch begins timing. Once the pool ball had traveled the distance and crossed the marked finish line, time would be stopped and recorded. This process would be repeated a minimum of ten times per angle. The angles that I tested were 20, 30, 40, 45, 50, and 60. Once the ten data points were gathered at each angle, I would find the average length of time the ball would take to roll down the plane at each specific angle. Once the average time was recorded, the real physics could start being calculated. My original plan was to test and hopefully discover trends with just the average velocity of the ball in comparison to the angle, but I decided to take it a step further and measure trends in all the aspects of velocity. To do so, I first broke the displacement of the plastic track (1.2192 m) into vector components. Using the laws of Sine and Cosine I could find how much of the total displacement was either horizontal or vertical. Once I had broken it into vectors, it was a simple “SUVAT” equation that would give me the final velocities. I used the formula, V^2= U^2 + 2as, to find the vector components final velocities horizontally and vertically, as well as combining the two to get the overall final velocity of the ball. Once I had gathered the more specific data, I was able to calculate the average velocity of the ball for each angle by dividing distance by time. To break the average velocity into components I used the laws of sine and cosine again. Taking the project to the next level and breaking it into vectors and using averages gave me a lot more data that could help further my knowledge of the growth rate of velocity in relation to the angle. The results of my experiment turned out to be far more informative than I would’ve anticipated. I was able to clearly see the inverse variation and relationship between the horizontal and vertical final velocity. The graph demonstrates an almost perfectly inverse relationship of the two values. In addition to a graph of the final vertical and horizontal velocities, I created an average velocity comparison graph. In this graph you can see that the average horizontal velocity is showing signs of a parabolic function. While the slope is at a lower angle it has a slower horizontal velocity, but reaches its peak at a forty five degree incline. Once it passes its peak it begins to drop again. When the incline is over forty five degrees most of the ball’s velocity is going to be in the vertical direction rather than horizontal, causing it to decrease. You can also see the beginnings of an exponential growth in the vertical velocity. This is a great demonstration of the exponential nature of both horizontal and vertical velocity in terms of the angle of incline. My final graph showed the increase of the final velocity and average velocity from one angle to the next. This is what I wanted to know all about from the beginning. In the case of both the average and final velocities, the increase is exponential. From one angle to the next the velocity increases more and more than the time before. My results showed convincing trends in many cases, however, throughout the experimental process there were many different things that may have caused uncertainty with the data. Anytime you rely on a human source to do any kind of timing, uncertainty and errors are inevitable. I recorded a number of outliers during my time trials and simply threw them out. Yes, that is somewhat manipulative and arbitrary, but they seemed very obviously irrelevant to me. Despite the fact that logic tells me I was right, simply throwing out collected data can definitely cause a change in the outcome of an experiment. Second to the timing errors would be angle measurement. I used a simple protractor to mark the angles on my setup, but it was not a flat surface I could measure as easily as a picture on piece of paper. Going through the tests over and over, I also came to realize that there was a slight flex in the body of my plastic track. This is yet another hit to the measurement of my angles. Although there was error and possible manipulation, I feel my results have shed light on the problem at hand. |