RESULTS/ DISCUSSION—
As we know that all individuals possess different
sound localizing abilities, we attempted to vary the subjects of our research
by gender and music ability. However, this diversity contributed to a vast
range in data, and such a high level of uncertainty (an enormous 33 ° for the data of
saw tooth waveforms), that our results have proved nearly inconclusive. Subject
D (trials 10-12), for example, had absolutely no musical background and was
once 52° from localizing the origin of the 550 Hz Saw Tooth wave; for that
same waveform and frequency, though, he was at one point merely 6 ° from
localizing the sound (see raw data). Such inconsistency could be
attributed to the fact that he has not been in a music ensemble where sound
localizing is a necessary and frequently-used ability, that
he may have suffered from hearing loss, or may have simply been because of
carelessness on the subject’s part.
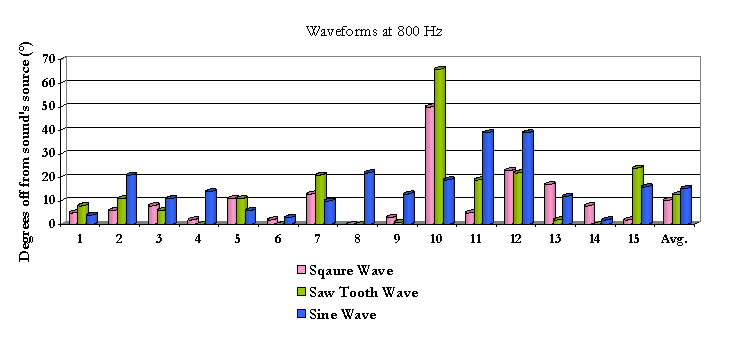
One has only to compare Subject B’s
(trials4-6) and Subject D’s results for the 800 Hz Saw Tooth waveform (see
Figure 7) in order to grasp the role a musical background
plays in identifying the location of sound. So while we figured variety within
our subjects would offer more realistic results, it botched the outcome. If we were to further investigate the effect
of timbre on sound localization, we would need to separately compare the
results of subjects with musical ability and those without. Had we been able to
test more subjects, we would have been able to identify a pattern (if any)
amongst nonmusical individuals and musical individuals. But because the room we
conducted our research in was in use by the drama department and could only be
used during the school day, we encountered difficulties in removing subjects
from class. Had we separately tested musicians and non-musicians, it is likely
that a change in timbre would have affected a musician’s sound localizing
abilities more than a non-musician’s, since musicians are often
fine-tuned at identifying sound color.
Despite the variance in our data, a sketchy pattern can be identified for
both Procedure 1 and Procedure 2. On average, at 800 Hz, our subjects were
approximately 10.3° off from locating the
origin of the square waveform. At the same frequency, we saw a decrease in
accuracy for the saw tooth wave, with subjects being off by 12.7°.
The sine wave proved the most difficult to localize, with an average of
15.4° off (see raw data). As illustrated in the bar graph (see Figure 7), the average ability to localize the sound
decreased from square waveform, saw tooth waveform, to sine waveform. While the
sine waveform was the most difficult to localize—as we predicted in our
hypothesis—the saw tooth waveform—which possesses the most harmonic
content, and thus, the richest timbre—was not the most accurately
localized sound, but rather, the second. Taking an uncertainty of 33° into
account, these results may mean nothing at all. However, under the unlikely circumstances that our results are actually
accurate, it is plausible that the saw tooth wave’s “buzzier” timbre—the result of its vast spectrum
of harmonic content—slightly inhibits the listener’s ability to
identify the origin of the sound. Perhaps the square wave— which has half
the harmonic content, is less “buzzy”
than the saw tooth and richer than the sine wave—is the perfect median
between colors of sound. It is important to note that in the world of music,
however, no instrument will be creating harmonics at every integral multiple
above the fundamental, or even every odd integral multiple. But there will be
instruments (and voices) whose harmonic content resemble one waveform over
another, and thus, whose timbre may either be purer, richer, or “buzzier”. Based on what data we collected at 800 Hz
(a note easily played and sung by musicians), we can ambiguously conclude that
musical sounds that are clearer and brighter will be more difficult to
localize, whereas darker and richer timbres will be easier to localize. Further
investigation, as stated before, would likely allow us to support such a theory
with mathematically findings of greater certainty.
Figure 7- Ability to Localize Sound (in degrees) vs. Waveform

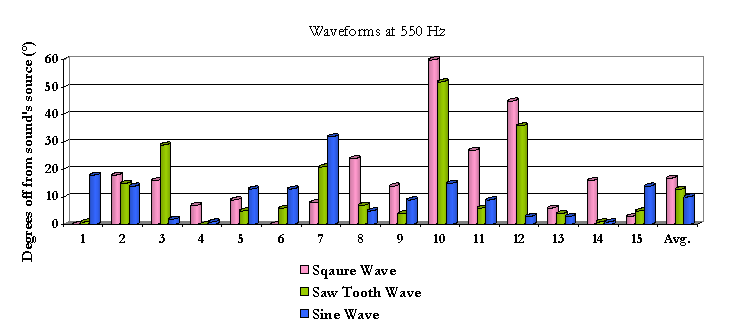
Even more disappointing than our results at 800 Hz
were those at 550 Hz. While there was slightly less certainty (30°), our findings made
less scientific sense. As shown in Figure 9, listeners on average were 16.9°
from locating the origin of a square waveform, 12.8° from localizing a saw tooth
wave form, and 10.1° from localizing the sine waveform. By comparing the graphs
(see Figures 7 and 8),
it is evident that at 550 Hz, our results showed the exact opposite pattern as
at 800 Hz. While the degree of uncertainty technically makes are results
inconclusive, the fact that 550 Hz provided the opposite results is still more
or less troubling. While the data at 800 Hz followed some sort of scientific logic,
our results at 550 Hz do not. It does not seem conceivable that a clearer
timbre with absolutely no harmonic content would actually be the easiest to
localize, so such findings are likely due to the significantly high values of
Subject 4 (as mentioned earlier), or even error.
Figure 8 Ability to Localize Sound (in degrees) vs. Waveform
