Lee Zimmerman (Leviticus) and Matt Thoenes's (Tones) CRAZY WebPage
There are three aspects to any sound. First there is a source. Second, the energy from the source creates a longitudinal wave. Thirdly the sound is detected by and ear or instrument. Sound waves are vibrations that travel through matter. Therefore sound cannot travel in the absence of matter. The speed of sound varies, in air @ 0º c and 1 atm, sound travels @ 331 m/s (http). Two aspects immediately evident to a human listener are loudness and pitch, both are subjective, but correspond to a measurable quantity. Loudness is related to the energy in the sound wave and pitch is related to the frequency. The audible range of human hearing is 20Hz to 20,000Hz. (Hill)
There are many types of waves. One important sit he standing wave, which occurs when a string with one fixed end is vibrated at just the right frequency where it appears that it is not raveling. In a string, the points that remain still are called the nodes (where the guitar string is attached to). These are points of destructive interference. The opposite of a node is an anti-node. This is where the wave oscillates with maximum amplitude: in other words the bottom of the trough of the top of the crest. (Giancoli)
The frequencies as which standing waves are produced are called the natural frequencies or resonant frequencies. Depending the length or mass of a string, it will affect the resonant frequency. (Lide)
The Lowest resonant frequency is called the fundamental frequency, which only has one anti-node or loop. The wavelength of the fundamental frequency is one half the length of the string, thus L= ½ λ. Every Fundamental after the first is called an overtone (which we won’t be looking at). The fundamental frequency is also referred to as the first harmonic. F= (M/L) v. F is the frequency. M is the mass of the string. L is the length. V is the velocity of the wave. (Giancoli)
Our research question brings us to what is the relationship between where a string is plucked and the intensity of the different harmonics of the note? Seeing as though guitar strings are setup so notes are equal distances from each other we can hypothesize that the distance of the string plucking to the bridge is proportional to the intensity of the harmonics.
Equipment:
- PC equipped with Multi Purpose Lab Interface (MPLI)
- MPLI Software
- Microphone (tailored for MPLI)
- Acoustic Guitar
This is a diagram of our setup:

The equipment mentioned on the previous page is hooked together to form the setup diagrammed above. The microphone is placed near the guitar and is hooked into the MPLI via one of its DIN ports. The MPLI is connected through a specialized expansion slot card.
Here’s a run down of how the data is gathered. First a person properly holding the acoustic guitar plays a note in a specified location (for instance closest to the bridge or closet to the head etc…). One second later someone at the PC presses enter so the MPLI program will begin collection sound data. Sound waves transmitted by the vibrating guitar strings are picked up by the microphone (tailored for MPLI specifics) which is held close to the sound hole. The sound waves are then transferred to the MPLI box and through the MPLI expansion card in the computer. Data is then analyzed by the MPLI software where convenient Frequency Spectrum Graph is created onscreen. Our reasoning behind the design is simple; the MPLI data transfer is the most accurate sound gathering device available. And conveniently enough it is available for DOS based operating system, so the PC is a must have (none of that Apple stuff).
We selected certain open notes of the guitar. In this case the high open E, open G, and open D (strings number 1, 3, and 4 in standard tuning). Each note was plucked with and without a pick. Also each note was picked at selected equal distances (nearest to bridge, furthest, etc…).
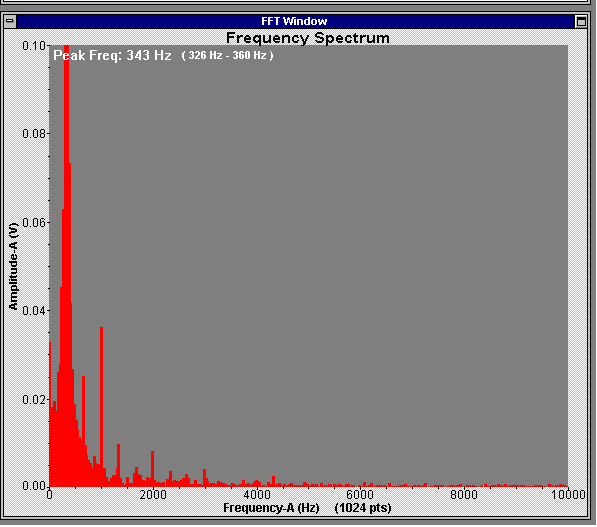
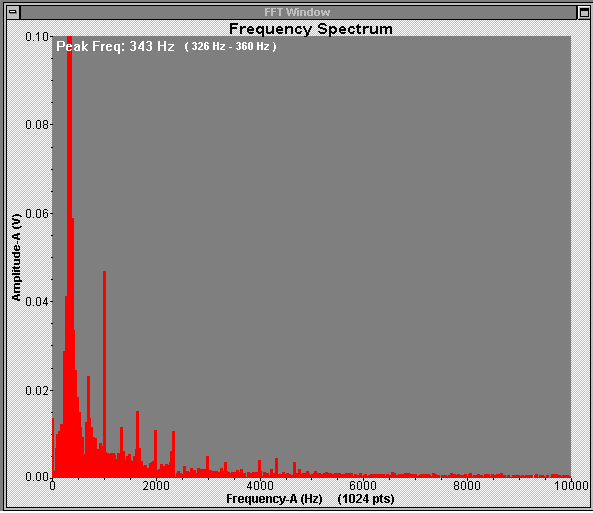
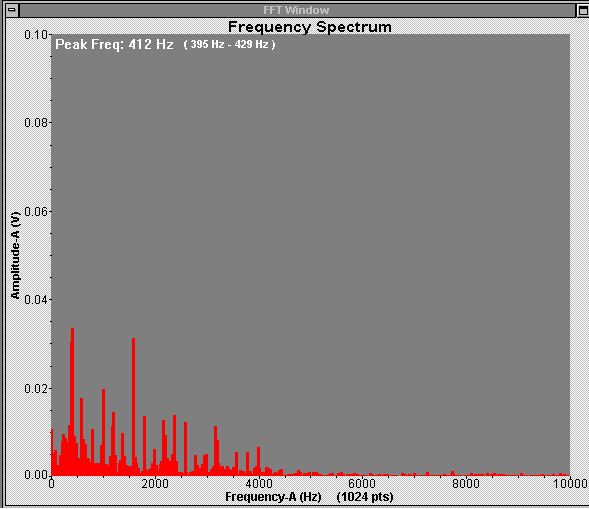
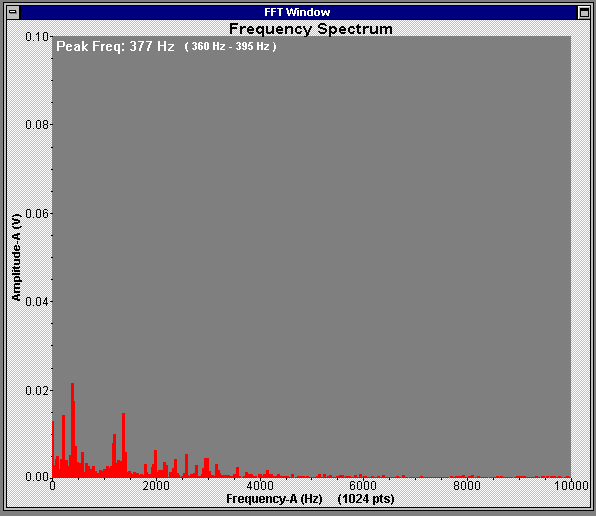
There are many types of uncertainties that could have skewed the results. The first of which being that the picking distances were not always “dead-on-balls accurate” (Vinny). Next the Placement of the microphone was not always consistent. And lastly the timer on the person pressing the button to collect sound data was not always one second after. The next page is a sample data graph via the fast furrier transform. ROCK OUT!
We used an approximately 0.5mm guitar pick, when not picking the right index finger was used. Referring to the open E graphs with and without a pick, they appear to be quite similar. As it turns out using the pick or not using it did not affect the data.
Another thing that affected our results was the distance from the bridge. Contrary to our hypothesis the amplitude is affected by the distance from the center of the string (12th fret) and not the distance form the bridge/head. Referring to the open E graphs of distances ¼ and ¾ from the bridge (which are equidistant from the 12th fret) shows that the amplitudes are almost identical. The reason why they might not look exactly the same is because the distances plucked/picked were not always exact.
Also we noticed that the amplitudes at the bridge and the head
regardless of the note were also very similar, if not exact. Although the
graphs displaying the bridge and head were slightly less similar then the ¼
and ¾ distances. This is because the distance is longer therefore there is
more room for error. Analogous to when measuring distances in yard sticks, if
each yard stick is off by 1%, then the longer the distance the greater the
error. In addition, plucking/picking at the bridge/head is more difficult to
the some same volume/sound, especially when picking.

Open E note without a pick 3/4 up from the bridge

Open E note without a pick 1/4 up from the bridge

Open G note without pick at the bridge

Open G note with pick at the bridge
The following is a comment written to us by a fellow Physics student after our presentation in January.
"Matt & Lee -
Although your project was entertaining and your rendition of "Stairway to Heaven" was the best I've heard in year, I was confused as to what exactly your research was trying to prove. Perhaps instead of striking the string at different places on the neck of the guitar, a study in the harmonic inequalities of the guitar may have been more interesting and affective. The graph showing where the string was struck proved something, I'm sure, but I don't know what. Furthermore, I would like to pose a question: What kind of bird brings no baby?
- Tim Archer"
That is the only letter we received, and a great letter it is.
http://www.physicsofsound.com/
This site gives a great overview of sound and its properties. It includes visual and numerical representations of sound delves into black body radiation.
http://www.cec.mtu.edu/csa/courses/presentations/kilpela.htm
As it turns out this site is actually just a site that links you to a multitude of other websites regarding sound. So it's a good resource of resources.
http://www.cssd11.k12.co.us/science/4sound/4sound.htm
This is a good basic overview site on sound. It even has activities and questions to help retain the sound knowledge.
http://www.glenbrook.k12.il.us/gbssci/phys/Class/sound/soundtoc.html
With this webpage a greater understanding of music can be obtained. It goes over behavior, harmonics, frequency, etc...
http://physics.about.com/cs/acoustics/
Saving the worst for last. This site is also more of a resource gallery to other links regarding sound.