Heat Distribution in Microwave Ovens
TOP / METHOD / DATA / CONCLUSION / GRAPHS / LINKS / BACK TO RESEARCH PAGE
In today’s society, the microwave has become an
essential part of our industry. Its’
usage varies from drying ceramics to detecting speeding cars and treating sore
muscles (Michale Oudlaug). However, the
most common use of microwave energy is in microwave ovens.
A microwave is a high frequency
electromagnetic wave, one millimeter to one meter in wavelength. This energy was first transferred to create
a microwave oven by Dr. Percy Spencer.
He was experimenting with new vacuum tubes called Magnetron, which are
derived from the nucleus of a high voltage system. Then, he noticed a candy bar melting in his pocket next to the
vacuum tubes. As a result, the melting
candy bar triggered him to conduct more experiments using the Magnetron tube
with different types of food. He discovered that electromagnetic through
magnetron tube causes food to cook at a fast rate (Gallawa). He soon directed the microwaves into a metal
box, not allowing any energy to escape; the first microwave oven was created.
The electromagnetic produces heat
within the food and causes the water molecules to vibrate at a faster
speed. As a result, the food is heated
at a faster rate. However, although
microwaves heat food faster, without a regulating device, such as a rotating
plate, they are unable to distribute the heat evenly. The cause of this is the standing pattern of waves that create
hot spots within the appliance. This
problem was carefully tested by Alistair Steyne-Ross and Alister Riddle. They heated a Cobalt Chloride soaked paper
in a microwave oven and examined the change in color on the paper. This was possible because the paper has a
characteristic of turning pink when wet and blue when dry (Beaty). So where are the hot spots in the microwave
oven? Our hypothesis states that the
middle of the microwave oven will be the hottest while the top will be warmer
then the bottom and the edges.
Method:
TOP
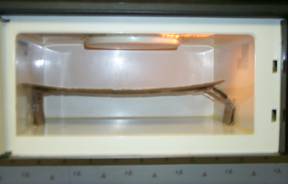
In order the measure the
distribution of heat inside a microwave oven we used a General Electric Co. Spacemaker
500 watt microwave oven. We then made a
cardboard stand which would hold up our fax paper (Perfect print, high
sensitivity fax paper). We measured
the dimensions of the microwave to be 8x12X19 inches. Then, we cut the cardboard to 16x10 ½ inches, adding supports to
the ends of a board in order to adjust the height using scotch tape and a ruler
to measure.
Figure 1
Next, we cut 26 sheets of 11 x 8 ½ inch fax
paper. We connected two sheets, total
of 13 sets, of papers to be 11 x 17 inches per connected sheet in order to
cover the whole surface of the oven.
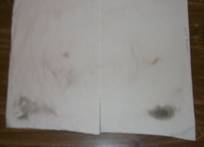
Using a paint brush, we brushed room temperature water onto the spread
of fax paper, placing it glossy side up in the microwave oven, and heating for
1 minute and 30 seconds. Repeating this
step 5 times we tested the paper at the bottom of the microwave oven, 2 inches,
4 inches, 6 inches and at the top.
After recording and analyzing the data on the brushed sheets of water,
we repeated our steps, this time soaking the sheets for 1 minute, instead of
brushing them with water. Again,
placing and heating the paper at the bottom, 2 inches, 4 inches, 6 inches, and
at the top of the microwave oven. After
recording this data, to prove our results accurate, we did a second trial of
each step.
Data analysis:
TOP
The results show that at the bottom
of the microwave the hottest spot is the innermost section of the microwave,
near the back, about 6 inches from each side. They also show that the second
hottest spot, at the bottom of the microwave, is the front and about 6 inches
from each side. The soaked and not
soaked papers show similar results at the “bottom” paper. Next, we raised the height to 2 inches from
the bottom. The results show that, when
dividing the paper in half, both the center of the right and left sides is the
hottest. In other words, the spots
about 3 inches from each side of the paper at the middle part are the hottest
spots. The soaked paper show this more
clearly then the non-soaked paper, although the resulting spots are in the same
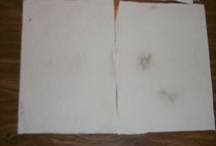
areas. Then, we analyzed the middle of
the microwave, 4 inches from the bottom.
We found that the only hot spot was the center of the right side of the
paper, when dividing the paper in half.
The spots are about 5 ½ inches from the side of the paper. At the 6 inch level from the bottom, the
hot spots are at the front of the microwave, about 1 inch from the sides. This time, the non-soaked sheet’s results
were clearer, although the non-soaked and soaked papers show similar resulting
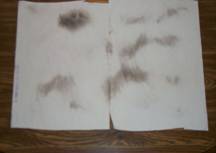
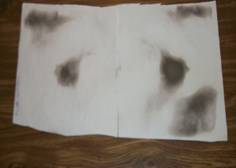
spots. Finally, at the top of the
microwave, our data shows a distinct pattern from which resembles the circular
generator at the top of the microwave where the heat is released. There is a circular outlining starting about
4 inches from the sides; especially strong on the sides of the circle. Then, the next hottest spots show up in the
far left and the front right corners, where it mimicked the semi circle
outlining.
Bottom: 2”
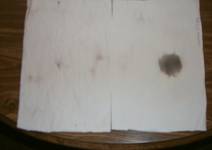
4” 6”
Top:
Conclusion:
TOP
Compared to our hypothesis, that the
middle at the top would be the hottest sections, the result showed
differently. The result show that the
top and around the edges are the hottest spots and the least hot was in the
middle. This pattern continued
throughout the distribution of heat, as it travels downwards from the top
through the sides of the microwave until it gets to the bottom where it eventually
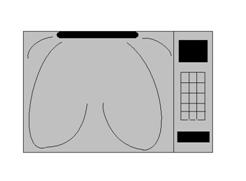
begins to distribute evenly, making the middle the least hot of all. It seemed that remaining heat at the bottom
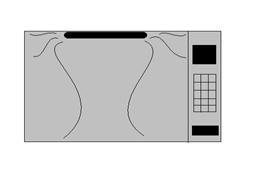
travel back up through the middle, taking on a “W” shape. Another possible conclusion is that instead
of the electromagnetic waves making circular patterns from the top to the bottom
and back up, it went in an “S” shaped pattern.
W wave distribution S wave distribution
The experiment however was not fool
proof. First of all, there was no way
to measure the amount of water which was absorbed into each sheet of
paper. After a few trials of heating
the cardboard with wet paper on top, the heat caused the board to slightly
curve up on the ends. The height
difference between the edge and center may have resulted in compromised
data. Although we used a ruler for all
our measurements, there is always a possibility for human error.
For additional support, we could
have done a trial with the fax paper vertical on each side and in the center of
the microwave. This would have showed
the progress of the wave at that point.
Compared with the horizontal data, a vertical measurement could have
helped in narrowing down the wave pattern.
In conclusion, when putting food in the microwave next time, think about
where it is placed.
Graph & Relevant Data:
TOP
The following graph is drawn to clarify the most
common hot spots that are shown in the results. The domain indicates the fax paper divided in sections in order
to point out the specific spots. Also,
the range indicates the number of hot spots that appeared on the certain
spots.
Frequency
of Hot Spots
*In order to clearly understand the divided sections of the fax paper, indicate the diagram depicted on the next page.
Diagram of fax paper samples
http://www.usmicrowaves.com
The us Microwave company made this site to give consumers all the information
they could want, starting with the background and technology of what makes them
run, to ways you can repair any problems you might be having with it.
http://www.gallawa.com/microtech/history.html
This site was great in describing how microwaves were first discovered and how
the experiments were accidental in leading to this modern day necessity.
http://imagers.gsfc.nasa.gov/ems/micro.html This link gives many examples of what microwaves are used for aside from their use in microwave ovens.
www.mercola.com/article/microwave/ This article goes into detail on how the microwave ovens work, and some of the hazards that they provide when cooking food with them and that we should be careful when heating certain items.
http://home.howstuffworks.com/microwaves.htm This describes the technology behind how the microwave energy is used to cook the food, and how they are able to cook the food more evenly then conventional ovens.
http://www.ziprealty.com/buy/appliances.jsp - Very cool web page that pretty much has everything about Microwave ovens, including some history (Thanks Abby!!!!!!)