Operation
Thud: A Study of the Effect of Air Friction on Distance Traveled?
By Julia
Scanlon and Elizabeth Johnson
January 13,
2003
IB Physics II, Period 8
Featuring: THE WOOD DUCK 2003 RAMP!

Table of Contents
Introduction (Background Info & Hypothesis)
 Background
Information/ Review of Related Literature
According to Stanley F. DeForest, Materials Engineering Researcher at Valeo Automotive, air has mass and will resist things moving through it. This means that any object traveling through the air is slowed by air friction to some degree. Air is somewhat viscous, which means it resists flow. Although it is not as resistant as water, air’s viscosity causes it to adhere to a solid surface and thus, slow down the air flow. This leads to a cushion of slowly moving air around a flying object (or pretty much anything that is moving), a type of boundary layer between the air flowing normally and the air around the object. When an object is flying through the air, its path is not perfectly parabolic. This is not only because the air friction causes the object’s horizontal velocity to decelerate as it flies through the air, but also because the air friction resists the downward movement of the car due to gravity, causing the vertical velocity to slow as well. Air friction has more of a visible impact of the flight paths of smaller objects than larger ones.
Aerodynamic drag is a force which resists a car’s (or other moving object’s movement. A drag force is created by this boundary layer because of what is called skin friction, or the friction between the slow moving air and the car. Another source of drag force is pressure drag, which DISCovering Science says is created when the shape of the surface changes abruptly, as at the point where the roof of an automobile ends. On cars with more blunt shapes, pressure drag is the main drag source and on cars with more sleek bodies, skin friction creates most of the drag. This is a key difference and any noticeable change in an object’s shape dramatically affects the drag, because shape is one of the biggest factors in the amount of drag produced by an object.
There is a mathematical way that aerodynamics experts calculate drag and show the relationship between drag, object shape, and some air flow conditions. This is called the drag equation and it is:
D= drag coefficient x air density x (velocity squared/ 2) x reference area
A reference area can be any easily measurable area (like the surface area or the frontal area, depending on whether you think of drag as being caused by air-body friction or by flow resistance). The drag coefficient is a number that is found by doing experiments in wind tunnels (thus controlling the velocity, air density and reference area) and measuring the amount of drag produced, then solving the drag equation for the coefficient like so:
Cd= drag/ (air density x reference area x (half the velocity squared)
This drag coefficient can then be applied to any other object with the same flight conditions.
We are going to find the ratio of the ideal/theoretical distance traveled to the actual distance traveled, thus exploring the effect of air friction on the distance traveled from the end of the ramp when a Hot Wheels car flies through the air being dropped at the top of a ramp.
Our hypothesis is that the actual distance traveled will be about 5% less than the ideal/theoretical distance traveled because the ideal velocity does not incorporate air friction and the actual distance traveled does. This would mean that the ideal distance traveled divided by the actual distance traveled would be around .05.
Here are the steps we used to obtain our data, as well as how we manipulated our data after the trials.
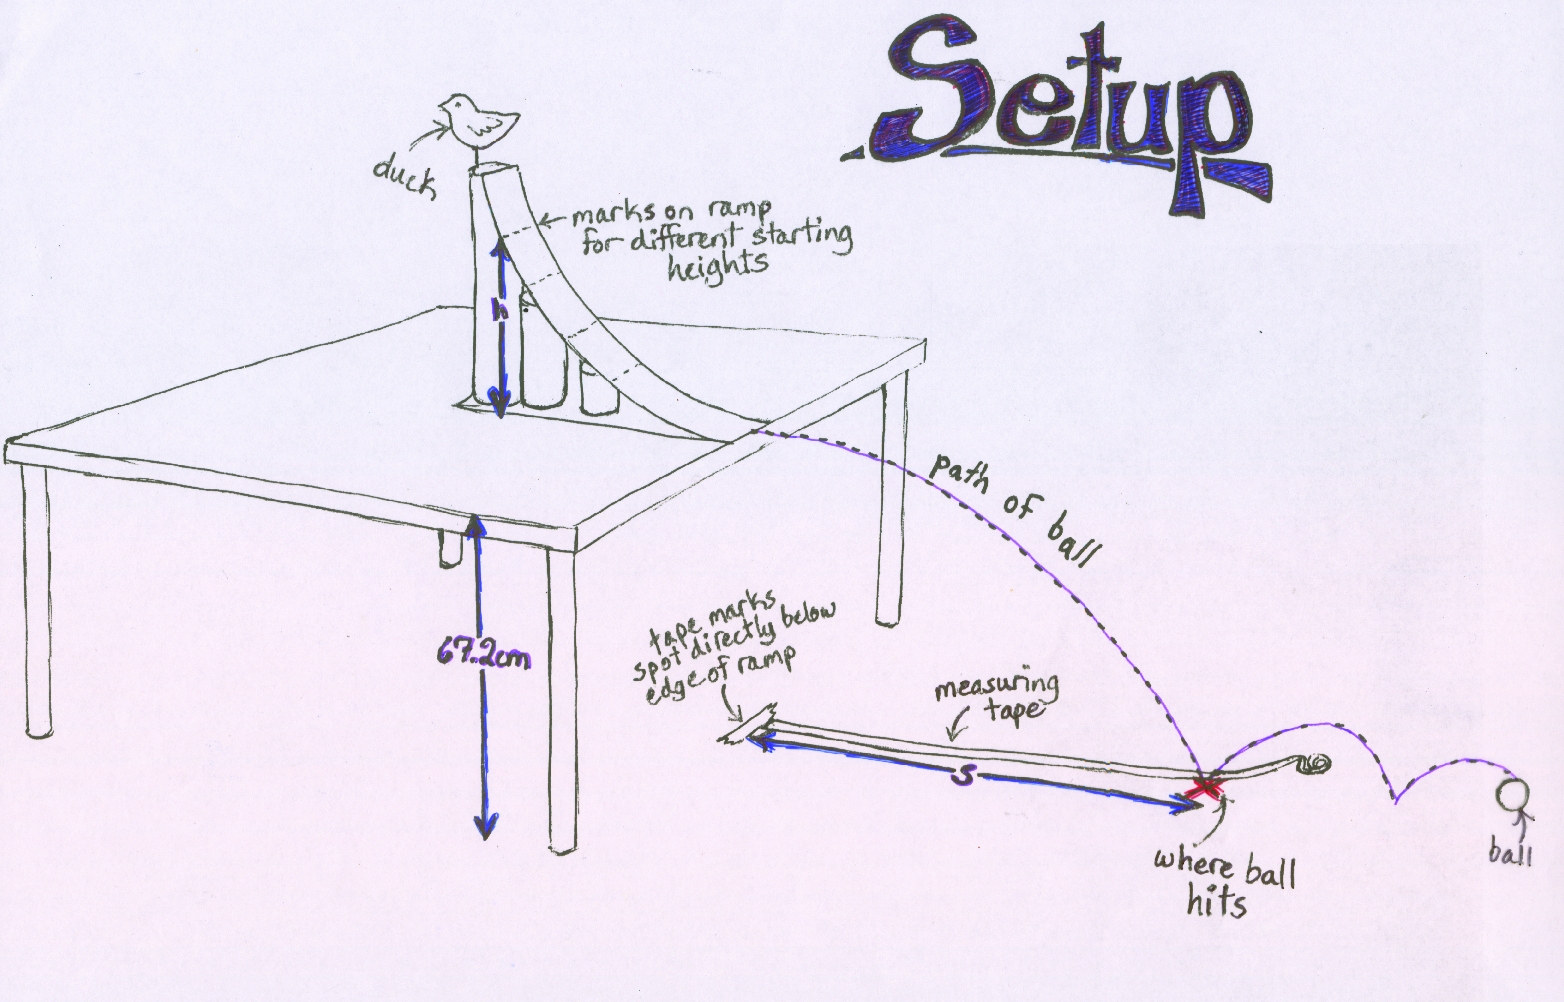
1. Measure the ramp height at different points, marking where you measured so you can drop the balls (see note on step 2) from these specific spots. Use the heights to find the theoretical displacement by first finding the theoretical velocity then using that velocity to find s (the displacement), like this:

2. Drop a couple of different balls from the various heights you previously marked on the ramp. The three balls we used were a ping pong sized mini basketball, a large gumball, and a small glass marble. For each drop, find the actual displacement by measuring the distance the ball traveled after leaving the ramp (see attached diagram). We did 5 drop trials of each ball at 5 different heights for a total of 75 data points.
Note: We originally wanted to use two cars for our experiment instead of balls, and compare skin friction vs. pressure drag on an object flying through the air instead of comparing the objects’ drops from different heights. However, the two cars we used gave us inconclusive data and they rarely landed on the same part of the car, making our trials inconsistent. The axles holding the cars’ wheels were also a bit shaky, causing the cars to not follow a straight path. With a little teacher guidance, we settled on balls of different densities at different heights.
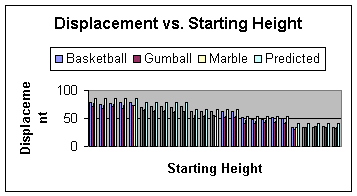
3. Graph the predicted and actual displacements. The actual displacements should be lower than the predicted. For our first two trials with the basketball (at 38.6 cm and 31.5 cm), our data was inaccurate and higher than the predicted, most likely because those were our first trials of the day and we hadn’t perfected our measuring by then. We solved this problem by doing 5 more trials with the basketball at these two heights and came back with better, more accurate data.
4. This step is optional, but for our own curiosities, we wanted to see if the densities of the balls had anything to do with our results. To find the densities, we weighed each ball and then used a piece of string to find each ball’s circumference at its widest point. By dividing the circumference by 2π, we found the radius (since c=2πr), and then put the radius in for r in the equation V= 4/3 π r. Using the volumes we found for each ball, we divided the volume by the mass to find the densities.
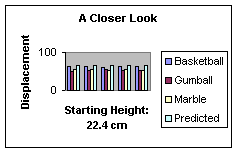
The following graphs and tables show our experimental results. An analysis of what we found is located in the Discussion section.


There were a fair number of chances for experimental uncertainty. As we stated in the Methods section, our basketball trials for two heights were obviously inaccurate, so we redid those trials to obtain better, more accurate results. Sources for error include human error, especially since the balls usually bounced or rolled away from their point of impact on the floor and thus we had to estimate exactly where it landed, by watching the ball as it hit. Human error could have also led to inconsistencies in the exact place the ball was dropped from and if the ball wasn’t dropped the same way every time. These human inconsistencies would affect the data by changing our actual displacement value that we measured. Other places where we could have made an error is the fact that we did not include ramp friction on the ball, which may have caused a slight loss of potential energy as the ball rolled down the ramp, making our theoretical velocity and thus our theoretical displacement slightly inaccurate. We also could have made errors in making the calculations, either in our algebra or in putting numbers in our calculators, which would have also led to theoretical velocity/displacement inaccuracies. Overall, however, we conclude that the chance for these types of error, especially given that we redid the trials that were obviously inaccurate, is rather small.
Based on our results, we conclude that our hypothesis was somewhat supported. Upon dividing the average actual distance for each ball at each height by the theoretical distance, we found that not only were the averages for each ball different, they were anywhere from 5-22 percents less, as opposed to our hypothesized 5 percent. Theoretically, the distance for all the balls should be the same, because the mass and radius cancel out of the energy equations we used. However, the fact that they are all different proves that friction plays at least some part in slowing the ball down, since friction depends on mass. Gravity is already taken into account by the theoretical equations, but there probably are some other factors that we didn’t account for that also slow the ball down, such as a slight drop in potential energy as the ball rolls down the ramp.
Our side explanation with density didn’t result in any patterns that we could see. The marble had the greatest density, followed by the gumball and then the basketball. However, the basketball went the farthest, then, oddly enough, the marble, and finally, the gumball. The switch in order of the gumball and the marble is interesting. We’d like to explore the density aspect of this experiment in greater detail sometime to see if our results are really accurate for this part.
Another interesting side aspect we noticed in doing this experiment was that the results were more erratic and spread farther apart for the higher heights as opposed to the nearly uniform smaller heights. We think that this is because the ball has more potential energy at the higher points, and consequently goes farther and has more time in the air. This makes it less likely to predict exactly where it will land. Another factor in this may be due to human error as well, because when the balls come from a higher height, they hit the ground more briefly than any of the other points and then bounce a lot. This could have created more chance for a measuring error and thus contributed to the erratic behavior of the balls dropped from higher heights.
Benson, Tom. “The Drag Coefficient.” Glenn Research Center, NASA. 2002.
------------. “The Drag Equation.” Glenn Research Center, NASA. 2002.
------------. “Size Effects on Drag.” Glenn Research Center, NASA. 2002.
------------. “Shape Effects on Drag.” Glenn Research Center, NASA. 2002.
These are all from the "Short Index of Aerodynamic Slides" web site
DeForest, Stanley F. “Re; how do aerodynamics affect a car.” MadSciNetwork:
Engineering archives. 14 Nov. 1999.
DISCovering Science. “Aerodynamics.” Gale Research. Farmington Hills, MI: Gale
Group, 1996. Reproduced in Discovering Collection Oct. 2001.
Science Joy Wagon. “Projectile Motion With or Without Air.” Lodi, NY: Science
Joy Wagon, 1998. (Click here to visit the site)
Other Good Sites:
"Air Friction" This site is part of HyperPhysics, a concept map based tutorial on a wide variety of physics subjects. It provides a
good basic overview of what air friction is and how it works.
"Flight" A basic site about flight, drag, and such. Really good diagrams.
"Notes on Air Friction" This site explains the cause of air friction in easy to understand terms and also talks about the frictional
coefficient of air friction for balls used in a projectile motion experiment. From a professor at Harvey Mudd College.
"The Physics of Baseball" Explains the drag and friction of a baseball with rad pictures.