kelly.intile & matt.george
TuHS Physics Home .:. Research
.: Background .:. Problem & Hypothesis .:. Materials & Construction .:. Method .:. Results :.
.: Photo Gallery .:. Analysis & Conclusion .:. Citations :.
Background Information: .:up:.
Our apparatus, commonly
known as Kundt's Tube, was originally designed to measure the velocity of sound
as it travels through a variety of substances.
It is built using an acrylic tube that is closed at one end with a sound source
at the other end. The tube lies
horizontally and the substance being tested is put into the tube. When the sound source is activated,
stationary waves can be observed in the substance. The wavelengths change according to the
frequency of the sound.
Chapter Fifteen of
Lehrbuch
Der Physik (translates to “Textbook of Physics”) describes Kundt's original
experiment. Kundt inserted a metal rod
and piston into the tube and rubbed it to attain the desired frequency and
generate the sound waves (we will use a loudspeaker instead). He also used cork dust to display the
wavelengths. As the waves entered the
tube, columns of dust rose at what we believe to be the nodes of each
wave. Knowing where these nodes occur
allows us to measure the wavelengths and, since we already know the frequency,
the speed of sound can be deduced from these measurements.
On the
Hyperphysics
website, the experiment is outlined and there is a video example. This particular experiment also uses the “rod
and piston” method of creating standing waves.
This website outlines the importance of longitudinal waves in explaining
the outcome of the Kundt's Tube experiment.
Since the waves feature areas of high and low pressure, the standing
waves in the tube are a result of variances in pressure, not waves of
displacement. The idea of reflection is
key to understanding the results of the experiment. Since the waves are reflected, the substance
in the tube is being pressurized by two sets of waves, traveling in opposite
directions.
Statement of the
Problem:
When the standing waves are created in a Kundt's Tube experiment, they are not formed by a smooth curve of raised cork dust (or whatever the substance may be). They are created by what we will refer to as “columns.” They are thin raised columns of the substance that correspond to the height of the wave at that point.
Our problem is to figure out why the
waves are created by these columns and not in a smooth, continuous
pattern. We will test how frequency
varies this pattern of raised columns.
Hypothesis:
We believe that since the
sound waves are reflected off the closed end of the tube, the opposite waves
colliding creates the raised columns.
Since sound waves are longitudinal (that is, they are made up of
alternating areas of high and low pressure), then when the waves collide, they
create areas of intensely high and low pressure, pushing the styrofoam balls
into columns in the shape of the wave.
Materials:
1
6 ft. long 3 in. diameter acrylic tube
3
ventilation funnels (3 to 6 inches)
a
lot of wire
6
inch car audio speaker
another
6 inch speaker after the first one blew
function
generator
amplifier
styrofoam
balls
static-free
spray (Static Guard)
tape
measure
Building the Tube:
Matt researched designs of
the tube, drew out a plan and then set out to find the
necessary items. Nate
and Matt took a trip to TAP plastic and paid $23.46 for the tube. The man that sold them the thing must have
thought they were going to use it for something other than physics, but we
still don’t know what else you could use it for. At Home Depot, no one would help them because
they are all tarts and know nothing.
They spent a half hour staring at different ducting funnels and finally
decided on a gradual funnel from 6 to 3 inches.
The rest is quite simple, you see.
Just rip a hole in Malerie Munro’s bean bag
chair and take a few balls, then Wham-o – you have a setup that looks
astonishingly like this:
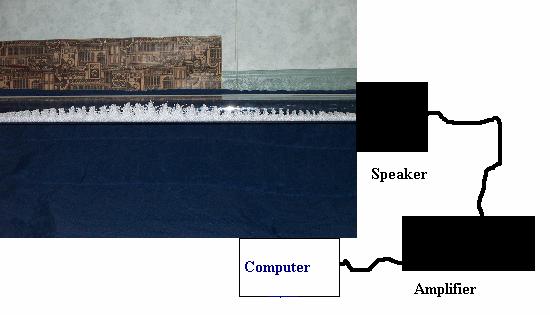
Method:
First, we decided to find out
everything we could about the waves in our tube. We used a computer program that generates a
certain frequency, then we hooked the computer up to an amplifier and to our
speaker. We varied the pitch and
amplitude until we got the nicest looking wave.
We measured the length of this wave from antinode to antinode and found
that length to be 43 inches. Since that
distance is only one-half of the entire wavelength, we converted 43 inches to
meters (43/39.37 = 1.0922 meters) and multiplied by two to get the entire
wavelength (λ = 2*1.0922 = 2.1844 meters).
Next, we had to determine the velocity of speed inside the tube using
the formula
v
= 331 + .06T. We measured the
temperature inside the tube to be approximately 21° C.
v
= 331 + .06*21 = 343.6 m/s. After we
figured out velocity and wavelength, we used the formula v = fλ to
determine the frequency.
343.6
= f * 2.1844
f
= 157.2972 Hz.
However,
we noticed that we were observing the first harmonic of the wave, not the
fundamental frequency. In a tube with
both ends closed, the first harmonic frequency is twice the fundamental, so we
divided 157.2972 by 2 and got 78.6585 Hz. for our fundamental frequency. After many trials and one broken speaker, we
realized that we couldn’t keep making our observations using 79 Hz. as our
frequency because it was too hard on the speaker, so we decided to use the
first harmonic instead (158 Hz). After
we had done all this math and measuring, we found a website that would calculate
up to 5 harmonics from a given tube length.
We measured our tube and plugged in the length and it turns out that all
our calculations were right.
At this point, we had calculated as much as we could about the waves, so we decided to test different frequencies and see if we noticed any change in the styrofoam columns. We observed that, at different frequencies, the formation of the columns was a little bit different. At lower frequencies, the columns were more chaotic looking:
At
higher frequencies, the columns were more neat and tidy; usually exactly one styrofoam ball’s width all the way across the tube:
This led us to believe that, at least in some way, frequency had a little to do with the formation of the columns. We thought for a while that it might have something to do with the fact that we were using styrofoam and that the balls kept getting statically charged. It was very difficult to observe what was going on inside the tube with styrofoam balls clinging to all the walls, so we eventually got some Static Guard and sprayed the inside of the tube and the balls. After we used the Static Guard, there were still columns, so we deduced that static electricity had nothing to do with it. Next, we considered the possibility that the properties of styrofoam itself had caused the columns. However, during our introductory research, we had read about Kundt’s original experiment, in which he used cork dust. The sources that described his experiment in detail also noted that he had encountered columns of cork dust as well, so the formation of these columns could not be unique to styrofoam. One of the most interesting things we noticed was that, when the amplitude was very high, the columns would start to collapse into each other in a sort of “tidal wave” effect. The styrofoam balls would bunch up at the antinode of the wave and push toward the top of the tube. After a while, they would form two “tidal waves,” each traveling away from the antinode, and eventually started spilling over and falling back down to the bottom of the tube:
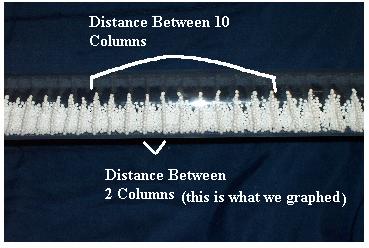
Eventually,
we decided that we would study the relationship between the length between each
column of balls and the frequency. We
accomplished this by setting the frequency to 70 Hz. and measuring the length
of 10 columns. We recorded this data and
tried again, this time with 75 Hz. We
realized that it would take too long if we continued to increase our frequency
by 5 Hz. every time, so we decided to increase by 10 Hz.
It
was difficult to measure the length of 10 columns because the styrofoam balls
were moving from areas of high concentration to low concentration. We had to stop and re-level our tube several
times. After we gathered all the data,
we converted from inches to meters and then divided by 10 to get the length
between two adjacent columns.
Results:
|
Distance
for 10 columns (inches) |
Distance
for 10 columns (meters) |
Frequency
(Hz) |
Distance
between 2 columns |
|
6 |
0.152400305 |
70 |
0.01524003 |
|
9 |
0.228600457 |
75 |
0.022860046 |
|
8.5 |
0.215900432 |
80 |
0.021590043 |
|
6.5 |
0.16510033 |
85 |
0.016510033 |
|
6 |
0.152400305 |
95 |
0.01524003 |
|
7.75 |
0.196850394 |
105 |
0.019685039 |
|
8.5 |
0.215900432 |
115 |
0.021590043 |
|
9.5 |
0.241300483 |
125 |
0.024130048 |
|
6.25 |
0.158750318 |
135 |
0.015875032 |
|
7.5 |
0.190500381 |
145 |
0.019050038 |
|
7.75 |
0.196850394 |
155 |
0.019685039 |
|
9 |
0.228600457 |
165 |
0.022860046 |
|
4.25 |
0.107950216 |
175 |
0.010795022 |
In
analyzing our graph, we noticed that the distances seemed to follow a pattern, which
repeated itself about every 40 Hz. For
example, the distances for 70 Hz., 95 Hz., and 125 Hz. are all within .5 inches
of each other. Considering how greatly
our results differed according to frequency, it is interesting to see how they
seem to vary in a cycle. We also noticed
that the frequency at which the distance cycled (40 Hz.) was almost exactly one
half of our fundamental frequency (79 Hz).
Data Analysis &
Conclusion:
Although we’re still not
entirely sure what causes the raised columns of styrofoam balls, we believe our
hypothesis may be at least partially correct.
When one sound wave is released from the speaker, it travels down the
tube, reflects off the closed end, and travels back toward the speaker. By that time, another sound wave has left the
speaker. These two waves collide and
create an area of intensely high pressure.
The styrofoam balls naturally want to avoid the areas of high pressure
and so they pile up in the areas of low pressure. This causes the column effect. Since different frequencies yield different
pressures of sound waves, it would make sense that different frequencies would
alter the appearance of the columns somewhat.
Even though we’re not sure exactly why the distances between the columns
varied in a pattern of almost exactly one half our fundamental frequency, we
have identified that there is some cyclical relationship between the two. Since our theory involves two waves colliding
and our measured data differs from our fundamental frequency by a factor of two,
our measurements may provide some mathematical support for our theory.
As for the “tidal wave” effect, we
formulated an explanation for that as well.
As the amplitude increases, it eventually exceeds the diameter of our
tube, causing the styrofoam balls to hit the top of the tube. As this happens, they are pushed away from
the antinode and begin to spill down the opposite sides. As these balls are displaced, others are sucked
in from the sides to fill the empty spaces the original balls left.
In evaluating our uncertainty, we found
many sources of error. The first one was
in our measuring of the wavelength in the very beginning of the
experiment. We estimated our length-measuring
uncertainty to be +/- 1 inch and our temperature-measuring uncertainty to be
+/- 1° C. So our highest and lowest
temperatures are 22°C and 20°C.
Similarly, our measurements could have been anywhere between 42 and 44
inches. To find our highest possible
value for frequency, we used the highest temperature and the lowest length
measurement:
v
= fλ
331
+ .06*22 = f * (42*2)/39.37
f
= 161.3236 Hz.
To
find the lowest possible value for frequency, we used the lowest temperature
and the highest length measurement:
v
= fλ
331
+ .06*20 = f * (44*2)/39.37
f
= 153.4538 Hz.
In
addition to this calculated uncertainty, there was a great deal of
indeterminate measuring error in our graph.
The data appears to be following some kind of pattern, but our data
varies from that implied pattern quite a bit.
Measuring 10 spaces between columns was very difficult, so the data is
probably skewed from human error.
We could make many improvements to our experiment to investigate these ideas further. With more time and resources, it would be interesting to test different substances in the tube and see how the appearance of the column varies according to mass or density of the substance. The best way to test our hypothesis would have been if there was some way to measure the pressure inside the tube while the speaker was generating a frequency, but we haven’t discovered a way to do that. We also would have liked to observe changes in the columns as the length of the tube is altered (by inserting a piston instead of the closed end cap). Despite its shortcomings, our tube is an effective way to observe standing waves and how they change when the frequency is altered, or depending on whether the ends are open or closed. Even though we didn’t reach a firm conclusion about why the columns are caused, we learned a great deal about standing waves and formed a reasonable conjecture about the appearance of the raised columns.
Bibliography:
Hyperphysics. http://hyperphysics.phy-astr.gsu.edu/hbase/waves/kundtosc.html
A website explaining the original experiment and setup.
Kundt’s Tube. http://w1.xrefer.com/entry/489550
Encyclopedia definition of Kundt's tube
Lehrbuch Der Physik. http://kr.cs.ait.ac.th/~radok/physics/i5.htm
Expanded definitions of wave theory
Standing Waves http://www.walter-fendt.de/ph14e/stlwaves.htm
Java applet that shows tube length to frequency correlation
Flame Tube. http://www.ph.unimelb.edu.au/staffresources/lecdem/wb3.htm
Similar to Kundt's tube, this one uses gas and the flames are differentiated in a wave pattern
Sargent Welch
http://www.sargentwelch.com/pdf/opins/84865.cfm/84865.pdf
A .pdf covering the original experiment, and additional ideas
Download Paper: research paper