HELP!!! We've lost our marbles!!!
A study of energy by:
Elizabeth Christina Campos- Furber and Whitney Amber Hiatt
Table of Contents
Introduction Method Results Discussion
Data Bibliography Return to Research Page
Do you ever wonder why you stop when rolling down a grassy hill? The answer, of course, is because you lose energy to friction. Similarly, a marble, when rolled down a plastic tube, also loses energy due to friction. In order to find out how much energy is actually lost, it is necessary to calculate the potential energy and subtract the rotational and translational energy.
According to Douglas C. Giancoli, the total energy for a body rolling down an inclined plane is the sum of the translational kinetic energy plus the rotational kinetic energy. Rotational kinetic energy is the kinetic movement of a body rotating about an axis. Translational kinetic energy is basically kinetic energy, with a different name and special meaning (the formulas are the same).
Our experiment is to see how much friction affects the energy of a rolling marble on three different surfaces. Since a rolling object has both rotational and translational energy, the variables we need to find are I (Moment of Inertia), ω (angular velocity), m (mass), h (height), v (velocity), and t (time). The equations we will need to use, and how we derived them, are as follows:
PE=mgh
Etrans=1/2(mv^2)
Erot=1/2(Iω)
I=1/2(mr^2)
ω=v/r
SO…
Erot=1/2(1/2(mr^2)(v/r)^2)
Erot=1/4(mv^2)
In order to find the velocity, we will need to find the time and have a set distance to measure. We will also make height an additional variable. We hypothesize that the amount of energy lost to friction will be highest in the rubber tube at all heights. We also believe that the plastic pipe will have the least amount of friction, thus making the greatest velocity. Finally, we believe that the loss of energy will be greatest on all surfaces on the smallest height tested.
TOC
Since our purpose was to find how much energy is lost to friction by rolling a marble down three different inclined surfaces and using the time for our calculations, we first set out to find surfaces that would vary in results. The surfaces we decided on were a wood edging, a plastic pipe, and foam tubing uniform in length and sanded at the edges to promote increased visibility. As for measuring the time, we soon discovered that using a stopwatch would be a problematic issue because the margin for error would be greater with humans operating it. Therefore, after thinking and researching, we decided to have the marble, after rolling down a surface, enter a plastic tunnerl with two beams of light set at a distance of three centimeters apart. When the marble would break the first beam of light, a circuit would send a signal to a computer program, which would start a clock that measured the time in microseconds. The computer would stop timing after the circuit would send it the signal that the marble broke the second beam of light.
We decided to use a computer program to measure our time after trying to use an ocscilloscope. We found that it was extremely difficult to be one hundred percent accurate with the measurements since we could not tell exactly where the jumps occurred on the graphs. So then we borrowed an ancient laptop with the program we needed already in it, except we had to make a few adjustments in the program to tell it to start timing when the first light beam broke (indicated on the program as “look for trigger”) and to keep timing (looping around) until the marble broke the second light beam. This solved our problem for measuring the time it took for the marble to go through the three centimeters.


As for our actual apparatus, we first had one uniform height to use with three different surfaces. This became a problem since that would mean we would only have three data points. Consequently, we took, the piece of wood off our project that was originally our height and started over from scratch. It was difficult to find a way to have infinite heights, so we started thinking about how we would make the stand go up and down. We then made a device out of a long screw, which we placed inside a copper tube for visibility and attached to a plastic knob, which increased or decreased the height by one sixteenth of an inch per revolution when you turned the knob. Now we could use any height we wanted from zero to twelve inches.
When we created the new stand, we also decided to make something which could go inside every surface to start the rolling more accurately. Before, we saw that the speed was different many times depending on how much force you pushed the marble with and where you started the rolling action. So, we made a starter out of leftover plastic piping and glued a small piece of wood on it that would hold the marble in place until flipping it up, which would cause the marble to roll from the same point each time.
When we first started this experiment, we used foam tubing because we needed a surface which would guarantee slow results. This worked when we had a uniform height, but when we changed the distance device, we realized the foam tubing would no longer work. When we moved the starter up on the foam tubing, the entire tube would flip up with the starter because it was too light to stay in place on its own. This caused a potential problem since we wanted to use three different surfaces. We had a good amount of plastic pipe left over (and knew the starter wouldn’t object to it), so we thought about what we could put into the pipe so that it would be almost or just as slow as the foam tubing was. We decided that rubber would slow the marble down and at least make the speed a great deal different from that of the wood and regular plastic pipe. So, we lined a plastic pipe with rubber and continued our experiment from there, collecting ten data points per surface per height.
TOC
The rubber-lined tube had the greatest amount of discrepancy with the data points. This is because of the fact that the rubber was extremely difficult to place in the tube and there were most likely bumps in the rubber that caused the time to slow up or speed down, depending on the trial. Therefore an error could be determined by the faulty lining inside the plastic tube.
Another problem we came into contact with was that of the starter. While the starter eliminated much of the varying forces that occurred within the experiment, it still used a different force which allowed the marble to go through at different speeds. For instance, when we pushed on the wood fast and hard, the marble appeared to go faster down the ramp and into the plastic tunnel, so we concluded that we needed to try to use the same force each time we pressed the starter. This, however, didn’t occur at all and we can see our faulty data points.
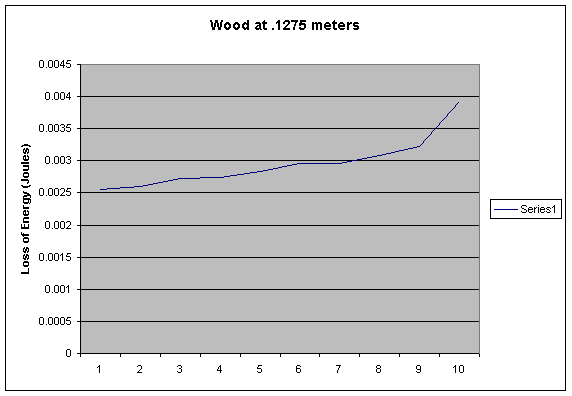
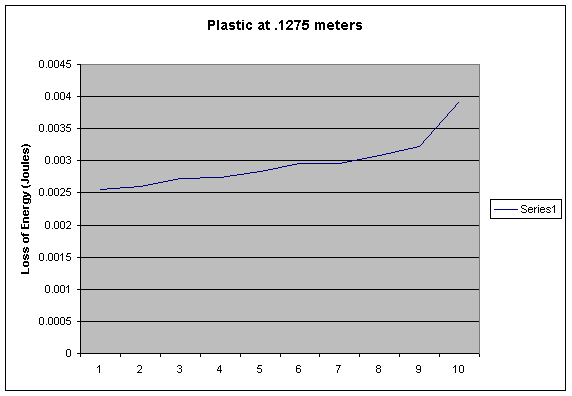
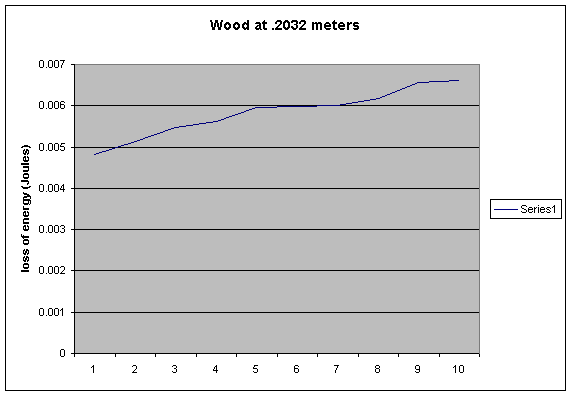
The other two graphs of the data (plastic at .1275 meters and wood at .2032 meters) are only to show how jumpy the rubber-lined tube was with the speed, and to compare them with.


Our hypothesis was as follows:
· The amount of energy lost to friction would be highest in the rubber at all heights.
· The plastic pipe will have the greatest velocity, thus making the friction less.
· The loss of energy will be greatest on all surfaces on the smallest height tested.
Our data supported the conclusion that the rubber-lined tube would generate the most friction. For example, for the height .2032 meters, the marble in the rubber lost an average of 8.27 e-3 Joules, where as in the plastic and wood they lost only 5.37 e-3 and 6.56 e-3 Joules, respectively. This could be because the rubber produces more heat, thus creating a greater loss of energy, or because it was bumpier.
The plastic pipe hypothesis that stated it would be the fastest is also correct, averaging 1.30 e–3 seconds faster than the wood and 6.10 e–3 seconds faster than the rubber on each height. This made the amount of energy lost due to heat and friction less than the other surfaces as well. This is most likely because of the smooth surface in the interior of the plastic pipe, which the other surfaces did not have.
The loss of
energy conclusion proved incorrect.
Using the wood edging as an example, the loss of energy at the height
.076 meters was a mere 2.57 e–3
Joules, as opposed to 6.56 e–3
Joules at .2032 meters. We think since
the time was greater at the lower height, the velocity was slower, and
therefore the kinetic energy would not have enough of an opportunity to
decrease, making it closer to the original potential energy.
If we furthered our experiments, it would be interesting to explore the relationship between lower heights and the resulting amount of energy lost. Another experiment we could try would be to see how much of a correlation exists between gravity and the overall effect of the energy.
To view the data from our experiment, click HERE.
-
Christian, Wolfgang and Novak, Gregor. "Rolling Friction"
<http://webphysics.davidson.edu/faculty/dmb/PY430/Friction/rolling.html>
What it is: an explanation of rolling friction and the forces and external circumstances affecting a rolling wheel.
-
"Combined translational and rotational motion"
<http://farside.ph.utexas.edu/teaching/301/lectures/node108.html>
What it is: a website that is extremely informative in the way of formulas, background information and experimental design regarding translational and rotational motion.
-
Schweiger, Pegy E. "AP Acceleration Down an Incline Major Lab Information"
<http://www.cyberclassrooms.net/~pschweiger/AP2dimmotpracticum.html>
What it is: an experiment similar to ours that assisted in the designing of the experimental set-up.
-
Wiebe, Arthur J. "The Marbelous Rolls"
<http://www.aimsedu.org/Activities/oldSamples/Marbelous/marbles1.html>
What it is: another similar experiment that helped us plan our procedure with it's helpful background information.
-
Wetmore, J.W. "The rolling friction of several airplane wheels and tires and the effect of rolling friction on take-off" <http://naca.larc.nasa.gov/reports/1937/naca-report-583/>
What it is: a practical application of rolling friction in the world of airplanes from way back when...