How Much Can a Rubber Band Stretch?
A study of the effect temperature has on the elasticity of a rubber band.
By Brittany Thom & Nina Murthy!!!
Table of Contents:
Words of Wisdom from Nina and Britt
Rubber is a widely used product around the world. The world consumes 15 million metric tons of rubber per year (Encarta 2001). This high value is due to the fact that it has thousands of uses in everyday life. Rubber-based products include from the obvious shoes, hoses and tires to the more obscure products such as cements, electrical insulating tapes and railroad tank cars. Rubber is such a versatile material because of its ability to be manufactured into hard or soft materials, insulating properties as well as its elasticity and flexibility, among others (Encarta 2001). Another of rubber’s important properties is its responsiveness to changes in temperature, which can be altered by the addition and subtraction of heat (McGraw 1960). This directly affects the amount of kinetic energy within the rubber (Lynds 1995). More kinetic energy means the molecules will move faster, allowing for rubber to have greater flexibility (Weast 1974). Both synthetic and natural rubbers encompass these attributes to roughly the same degree.
Synthetic rubber is more common, however, because natural rubber is only found in Brazil, Malaysia and Indonesia (Hawley 1981). In the United States, production of synthetic rubber became a necessity with the outbreak of World War II. Manufacturing plants were established and eventually by the late 1980’s the consumption of synthetic rubber outnumbered that of natural rubber by a ratio of three to one (Encarta 2001). Therefore, for this experiment we will be using a synthetic rubber product.
Specifically the problem we will be addressing is the effect of varying temperatures and forces on a rubber band’s ability to stretch. The setup of our experiment will subject a rubber band to different temperatures and use a weight to apply force, causing the rubber band to stretch. We will use a rubber band because it is composed purely of rubber and its shape makes it easy to pull, versus if we were to use a solid. Will the rubber band stretch more at higher temperatures or lower temperatures? We can test this by heating and cooling water and submerging the rubber band in it. Rubber’s property of water resistance allows for the rubber band when submerged in water to retain its original composition (Encarta 2001). Based on this background information, we hypothesize that the highest temperatures tested will make the synthetic rubber band stretch the farthest distance.
- 5 metal rods
- 2 table clamps
- 6 clamps
- 2 pulleys with ball bearings (to reduce friction)
- 0.5m of tightly woven string
- 1 Celsius thermometer
- 1 beaker of 4000mL
- one rubber band (0.006m thick, 0.08m in diameter)
- 1 plastic ruler with centimeters
- masses, which amount to 0.60 kg, for the pulling force
- 1 metal supporting bar with hook
- water
- stove and metal pot
- freezer
The preceding materials were combined to create a working apparatus as shown below.
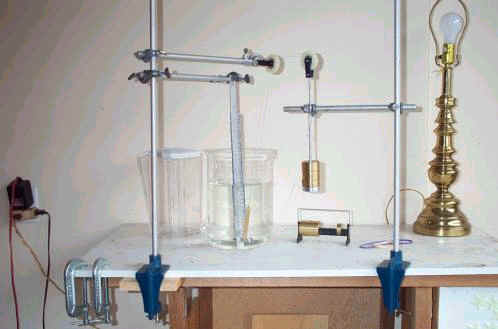
Note: Rods should be tightly clasped to ensure minimal movement.
We repeatedly stretched the rubber band by letting the mass hang down, so that there was a constant force of 5.9 Newtons (Force = mass*gravity) on the rubber band. We also changed the temperature of the water surrounding the rubber band to 16 different temperatures, with 12 degrees Celsius being the lowest temperature, and 81 degrees Celsius being the highest temperature.
We measured the length of the rubber band after stretching it by taping a plastic ruler to the bar in the water. The rubber band was looped around the hook, which was connected to the bottom of the bar. The ruler was positioned 0.01 meters above the bottom of the rubber band, so we had to add 0.01 meters to every number we got. Each time we stretched the rubber band, we could read the ruler through the glass of the beaker and determine the length to which it had stretched. It is important to note that the rubber band had to be of substantial width—at least 0.006m thick, and the force had to be large enough—at least five Newtons. This was because during the initial trials of the experiment, a rubber band 0.003m in width was used and a force of only 0.98 Newtons. We did not see any changes in the stretch length of the rubber band until we used a large enough force, with a wide enough rubber band.
We changed the temperature of the rubber band by submerging it under the water in the beaker, and stretching it there. We stretched it in the water, so that the temperature that we were trying to test would be completely surrounding the rubber band. We began our experiment by boiling water, and pouring it into the beaker with the rubber band. We let the rubber band sit for several minutes in the water, so that it would change to the temperature of the water. We then measured the temperature of the water, and after noting this; we stretched the rubber band, and wrote down its stretch length. We then released the rubber band from its stretched position, so as not to change its shape. We let the water cool down on its own, and repeated the process above at 12 different temperatures between 81 degrees Celsius and room temperature, which was 19 degrees Celsius. After we stretched the rubber band at room temperature, we dumped the original water, and poured water that was 12 degrees Celsius into the beaker for final observation.
As noted in the procedure, the general sequence of our procedure was that the 4,000mL beaker was first filled with the warmest water and tested for the elasticity of the rubber band submerged in it. Then, as the temperature of the water reduced—due to the natural heat loss of the water and the addition of ice cubes, as well as cooler water—the decreasing temperatures were tested using the same method. The raw data, as collected, is as follows.
These results seem to suggest that the greater the temperature of the water the rubber band was subjected to, the greater the elasticity of the rubber band. However, before any conclusions are drawn, it is important to note the factor of uncertainty when examining the above data points. Uncertainty could be identified as a significant contributor to skewing the recorded raw values because, firstly, the measurements of the rubber band were recorded based on human observation. This could have allowed for miscalculation of the eye due to human error. In addition, the human observation could have been further inaccurate because while looking through the medium of water contained within glass, one’s vision of the contents and of the ruler are distorted and can, thus, interfere with our results.
In order to account for this, during the experiment the rubber band was measured to a length using the ruler within the water as usual. A ruler outside the water was then placed next to the beaker and the rubber band was measured. A difference of approximately 0.001m was noted from the same vantage point. Thus, when analyzing the data points, one must take into account the uncertainty of:
0.001m (due to human error) + 0.001m (from water distortion) = 0.002m of total uncertainty.
This means a range of +/- 0.002m must be applied to the gathered raw data in the table and visual shown below. It is important to note that despite the difference in temperature of 69 degrees Celsius, the difference of stretch length was observed to be only 0.007m and the uncertainty calculated, in addition to this, provides for our values to be up to 2/7 or 28.6% inaccurate. Thus, the below line graph showing the relationship between the temperature of the water and the length the rubber band stretched, may reflect a relationship that is not accurate. Repeated trials were not applied as available supplies were limited to only one trial.
Another possible reason for
inaccurate data points could have been because the apparatus in itself had so
many “joints.” This created multiple places that needed to be checked
repeatedly to ensure they remained in the same position throughout. As the
values themselves are relatively small, any rod that is slightly out of place
could alter results significantly.
A line of best fit was included on our table to describe the general trend of our data points as a linear relationship. The equation of this line is y=0.0001x+0.1211. The R^2 value serves as a marker to indicate a likely stretch length for a temperature that was not specifically noted through experimentation. For example, 35 degrees Celsius was not measured for its corresponding stretch length. The line of best fit would therefore suggest a value that one could determine by the eye as just over 12.5cm and since the R^2 value is 0.9273, this would suggest the approximate value of 12.5 to be 92.73% correct based on the data points included in this graph.
Although this experiment’s findings did support our hypothesis as the higher the temperature subjected to the rubber band did indeed cause it to stretch the most, it was not anticipated that such a minute difference would be found between the stretch abilities of the particular rubber band at 12 and 81 degrees Celsius. This may be due to the factor of uncertainty to some extent, but also could be due to some flaws in the experiment itself. For example, the rubber band had been subjected to the warm water before the cold with the logic that it was easier to cool warmer water than start with cold water and take apart the apparatus at every stage to add warmer water and increase the temperature. In hindsight, it was suspected that the sequence of hot to cold allowed the components of the rubber band to increase their elasticity ability, as warmth generally allows for the atomic make up of substances to move more freely, characterized by greater flexibility. This is supported by our measurement of the rubber band before the experiment was conducted at 0.080m and after the experiment at 0.086m. This does, however, contradict with the statement made in the background information cited by Encarta 2001. This may be due to the fact that the rubber band used for this experiment may have been composed of other substances mixed with the rubber that do not retain their original state after being subjected to heat. Thus, an interesting extension of this experiment could have been to compare the results of the hot to cold temperature sequence and the cold to hot temperature sequence and note if the assumption previously stated was supported.
Also, a problem faced during this experiment was that even though the hot water was boiled and should have been approximately 100 degrees Celsius, by the time it was transferred from the cooking pot on the stove to a jug and then to the beaker, its temperature had gone down significantly. Thus, in order to achieve water temperatures greater than 81 degrees Celsius, a hot plate should have been used. This could be placed next to the experiment’s domain and transferred directly with minimal heat loss, versus the stove, transferring the water and then spending time to set up the apparatus once more to conduct the experiment.
Additionally, an often crucial element of many scientific experiments is that of repeated trials. They were not performed because repeating the procedure would not ensure the same temperatures were achieved and therefore would not make multiple trials comparable exactly. Thus, instead of trying to imitate the experiment’s exact temperatures (which is nearly impossible), once could try the experiment multiple times just to gather more data points and at that point, make a more valid conclusion based on numerous values versus the sixteen used in this particular experiment.
Other intriguing extensions of this experiment’s focus could have been to try multiple forces on the rubber band. This would add yet another variable to the experiment and might suggest another idea not addressed in this experiment, since only 5.9 Newtons was tested as a force. One could have also tested different rubber band diameters with consistent widths or vice versa and observed how this affected data.
Regardless, the specific problem this experiment provided an opportunity to gain some insight into the properties of rubber as a substance very crucial to the way of life many humans maintain. The ability to manipulate a substance, such as rubber, for such a wide variety of uses remains quite remarkable and quite a credible advancement on the part of mankind.
Links
http://www.polymer-age.co.uk/
Current
uses and news regarding the manufacturing of rubber.
http://www.rubbstone.com/
Information regarding some physical and chemical
properties of natural rubber.
http://www.psrc.usm.edu/macrog/exp/rubber/synth/asrrp.htm
History regarding some uses of rubber during
WWII.
http://www.firestonepolymers.com/applications.htm
Some application of synthetic rubber and properties
with regard to tires.
http://scifun.chem.wisc.edu/HOMEEXPTS/rubberband.html
Example of an experiment using rubber bands and
heat.
Encarta Encyclopedia 2001. “Rubber.” 1993, Microsoft Corporation.
Hawley, G. Gessner. The Condensed Chemical Dictionary. 1981, Van Nostrand Reinhold Company, New York, New York. Pg. 902
Lynds, Beverly T. “About Temperature.” 1995, http://www.unidata.ucar.edu/staff/blynds/tmp.html
McGraw Encyclopedia of Science and Technology. 1960, McGraw-Hill, New York, New York. Pgs. 672-684.
Weast, Robert C. (ed). Handbook of Chemistry and Physics
77th edition.1974, CRC Press, Inc. Cleveland, Ohio. Pg. 12-180.
Words of Wisdom from Nina and Britt
Actually, our wisdom needs to be censored on the basis that if we revealed our secrets, then our A's would be revoked. By the end of Physics II, you'll know what we meant!

Oaks Park 2001
Love always,
Brittany Thom
and
Nina Murthy
CLASS OF 2002!