Steve Kapfer and David Harms
Pressure Drag | Building the Tunnel | Experimentation | Data Collection | Problems | Picture | Works Cited | Links
Pressure Drag on Bluff Objects
Back
to Top
A biker riding down a hill often experiences wind resistance, or drag. If the biker wants to go faster the biker will crunch up into a tight ball, thus minimizing the amount of area that has to cut through the air, however if the biker wants to go slower the biker will expand their limbs, catching as much air as possible. Is there a correlation between the surface area of the biker and the amount of drag the biker experiences? Benjamin Robins was the first scientist to first discover the correlation between surface area and drag; however, many scientists before and after him helped tremendously to build a solid foundation of knowledge in the aerodynamic field, so that the complexities of drag and air turbulence could be discovered.
At first early discoverers had not the slightest notion or care about drag. Many of the attempts as first flight were simply imitations of nature, like the flight of birds, such as flapping wings and tails. However, these primitive forms flight would either end in failure or death. Controlled flight was pondered by many early scientists, like Leonardo Da Vinci, who drew more than five-hundred pictures and wrote more than thirty-five thousand words on the subject (Scientific American). Unfortunately, Leonardo Da Vinci and other early scientists who sought to solve the problem of flight faced three major factors, which they did not know much about: pitch, yaw, and roll. It would then be several centuries before any real test flights would happen.
Early
scientist knew that they needed a controlled environment in which to test
models. The easiest possibilities were to find natural sources of wind,
such as caves or by
simply
moving the object through the air at a desired speed. Scientist soon found
that both these approaches had too many variables and turbulence in the
air. Therefore, an effective, controlled environment needed to be created.
This was important as it forced scientists to build contraptions for testing
objects in the wind. This would lead to the production of the wind tunnel,
which ultimately allows many of the todays scientific discoveries in the
field of aerodynamics to happen.
Benjamin
Robins was the first person to invent a primitive, but ingenious apparatus
for testing objects in the wind. He called his 18th century
invention awhirling arm. A falling
weight on a pulley and spindle system sent an arm of four feet whirling
around at velocities of a couple of feet a second. While the machine had
many flaws, it was a major step in the right direction. Mr. Robinss whirling
arm also introduced new theories that countered Newtons earlier thoughts
about resistance. By placing different shaped objects on his whirling arm
machine with the same surface area he was able to measure resistance and
come to the conclusion that all theories of resistance hitherto established
are extremely defective. The reason for this conclusion was that he realized
that it was not just the surface area of certain objects that created resistance,
but rather, the shape of the object, its position, and air velocity that
created resistance. It would be Robinss realization that drag was a complex
set of situations that would lead other entrepreneur scientists to further
develop ways of testing the relationships between an object, its position,
the velocity, and drag produced on the object.
Sir
George Cayley is believed to have been the first person ever to get a heavier-
than-air
machine off the ground. He too used a whirling arm; although his was considerably
more powerful than Benjamin Robins, as he was able to get his arm tip
to rotate at speeds of twenty feet per second. In 1804 flew an unmanned
glider, and by 1852 he had built a triplane glider that had the beginnings
of features seen on aircraft. His most significant contribution, however,
was to suggest that one should make a surface support a given weight by
the application of power to the resistance of air, or simply, let the
wings of the aircraft lift and let the engine of the aircraft give it motion.
He also helped to draw interest into the field of flying, as well as generate
many questions about what allowed some of his aircraft to fly. This helped,
more specifically, to spawn questions about the forces that were acting
on aircraft, such as drag.
Frank
Wenham, who described his wind tunnel as a trunk twelve feet long and
eighteen inches square, to direct the current horizontally, and in a parallel
course, built the first wind tunnel in 1871. He discovered the lift-to-drag
ratios at low angles of attack were rather high, which differed from Newtons
aerodynamic theories. This simple discovery proved that flight was possible.
He also discovered the aspect ratio; long narrow wings are better than
short stubby wings with same surface area. His invention of the wind tunnel
however, was quite possibly his most important contribution to the field
of aerodynamics, as it finally created a controlled environment in which
one could test ones objects.
One major problem
remained however. Would an actual full-scale model act the same as the
model in the wind tunnel? Osborne Reynolds, in a series of experiments
showed
that airflow was the same for models in wind tunnels as for full-scale
models, and this factor was called Reynolds number. Reynolds number describes
all fluid-flow situations, such as shapes of flow patterns, the ease of
heat transfer, and turbulence. This would finally allow flight to be attainable
and for scientists to apply the data gained from wind tunnel experiments
to life-size objects.
This
papers goal is to prove one of Robinss experiments, that the drag force
on an object is proportional; Dfµ
SA, where Df is drag force and SA is the surface area of the
object. A wind tunnel will be built in which many of the environmental
factors, such as wind speed and flow, can be controlled. By using several
small, two-dimensional circles of varying surface areas inside the wind
tunnel, the equation Dfµ
SA will be proven. To further prove Robins theories on drag, it will be
shown that the shape of an object does not alter the amount of drag, rather
it is the amount of surface area that is placed directly in the wind flow
that changes the drag. Two other shapes, right triangles and squares with
the same areas will be used in addition with the discs to prove this concept.
Several
other important factors need to be recognized before the experimental process
begins. First, it is necessary to realize that there are two types of drag,
frictional drag (also known as viscous drag) and pressure drag (also known
as form drag or profile drag). Frictional drag comes from the friction
between the object and the fluid, in this case the air inside the wind
tunnel. Pressure drag is the formation of eddy currents that
are
caused by the fluid, passing over the object. This is the type of drag,
which will be
measured
in the wind tunnel, as frictional drag does not really become induced at
low speeds.
Pressure drag is also mainly recorded at high angles of attack. This is due to the fact that high angles of attack can cause the flow of the fluid to become separated. At low angles of attack the flow of the fluid is not separated, and the friction between the air and the object causes the drag, but as the angle of attack grows the flow of the fluid can become separated, and this separation causes pressure drag. As the angle of attack continues to increase the pressure drag rises, as does the separation in the fluid flow. The diagram below demonstrates the differences between frictional drag and pressure drag.
The
separation in the flow causes an increase in the wake and eddy size behind
an object, which in turn adds more pressure drag. The objects that will
be tested to prove Robins theories will be at the highest angle of attack,
that is, they will have the maximum surface area facing into the flow,
or they will be at ninety degrees.
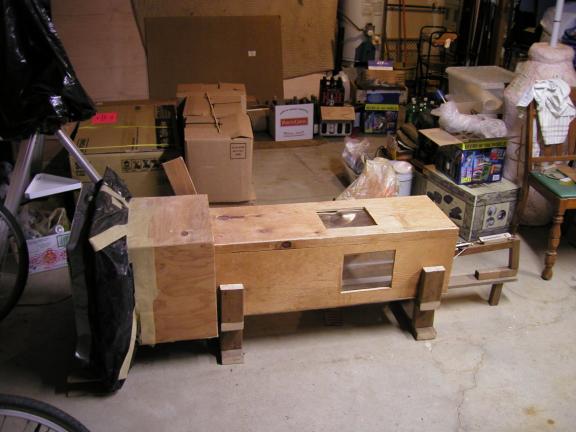
Building the Wind Tunnel
Back to Top
accomplish this four four-foot planks of a quarter-inch wood were used to make thetrunk of the wind tunnel. Wood was used because it does not allow much air to permeate through it, as other materials such as cardboard would. All four planks of wood were then sanded so that there would be very little wind resistance from having rough wood in the wind tunnel. The corners in the trunk of the wind tunnel were then caulked after they had been nailed together to guarantee that no outside air could leak into the wind tunnel and cause air turbulence. Two plastic windows were also inserted into the trunk of the wind tunnel for ease of observation, and appropriate measures were taken to securely fasten them to the wind to so that no air could get into the wind tunnel.
A
wood baffle was also built so that a four-square-foot fan could be siphoned
down to our one-square-foot trunk. All the wood for the baffle was sanded,
and all the corners were caulked. A garbage bag was then attached to the
outside of the baffle and adhered to the fan, insuring that the connection
from the baffle to the fan was sealed and no extra airflow could enter
the wind tunnel. The baffle also allows the wind speed to be theoretically
quadrupled. Due to mass conservation the volume of air entering the wind
tunnel must match the volume of air leaving the wind tunnel. So then, by
using the equation rA1V1
=rA2V2,
where rho equals the density of the air, A equals the area, and V equals
the wind velocity, one can calculate what the wind speed in the wind tunnel
should be with the baffle attachment. The surface area of the fan is 887
cm2, which is then siphoned down to a surface area of 221.76
cm2. The air speed that the fan produces is approximately 3
m/s, and since rho is the same for both sides of the equation it can be
cancelled
out. So, 3*887 = 221.76*V, and solving for V one finds that the wind speed
in the wind tunnel should be about 11.99, or 12 m/s. However, this was
not the case with our wind tunnel. Wind speed tests after the baffle was
built showed a wind speed of only 6.8 m/s.
To
eliminate any other possible a twelve-inch by twelve-inch by six-inch honeycomb
piece of cardboard was placed inside the wind tunnel. This forces the air
to straighten out; preventing it from creating any eddies where turbulence
can occur. A wire mesh screen was also placed at the mouth of the wind
tunnel, which further helped straighten the wind current, but because it
severely reduced the wind speed inside the wind tunnel it was removed.
To test to make sure the wind speed throughout the wind tunnel was uniform, a device was created made up of a Ping-Pong ball, string, and a protractor, which would allow the calculation and measurement of the wind speed in the wind tunnel.
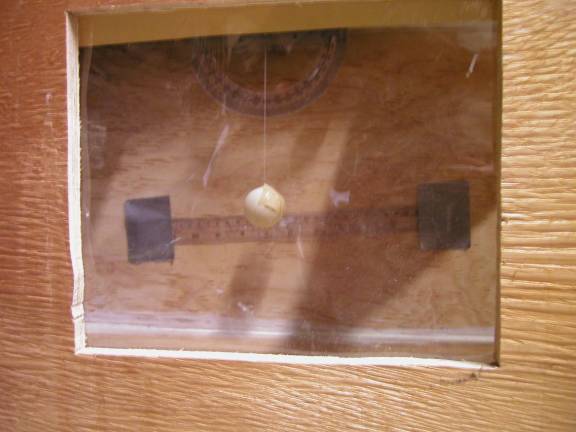
To find
the wind speed the formula v (velocity of wind) = 8.1(tan q)^1/2
(Scientific American) was used. The angle, q,
in the equation was approximately thirty-five degrees, so 8.1(tan 35)^1/2
= 6.77. The wind speed then was 6.8 m/s, and to make sure that the wind
speed was the same throughout the wind tunnel the device was simply moved
throughout the inside of the wind tunnel. Once it was established that
there was a consistent wind flow speed throughout the wind experimentation
was able to take place.
Experimentation
Back to
Top
Although, all of our forces had to be divided by two because one end of the string was attached to a fixed object while the other end was attached to the object in the wind tunnel. Although the half of the string that was fixed to the wind tunnel was at an angle, the angle force was neglected because it was felt that the resulting force from it would be minimal.
Next, it had to be decided on how to affix the objects to the end of the string so that they could be tested. The objects needed to be independent from the environment, and not be allowed to touch the sides or bottom of the wind tunnel, so that there would not be any friction acting on the object which would effect the results.
First, a converted model tank was tried, in hopes that the tanks well-lubricated wheels would allow the object to move down the wind tunnel with minimal friction due to surface contact. This attempt failed however, as the objects that were being tested caused the tank to become airborne. This would alter our project altogether if we
continued using the tank, so the idea was aborted.
A coat hanger was then tried. Each of the discs was pierced in the center, and placed it on a coat hanger. The hope was that the disc would side down the relatively frictionless surface, allowing us to measure the drag force without having to account for other forces affecting the object. Unfortunately, this failed as well. The coat hanger wire simply was not stiff enough to stay up for the length that we needed. It started drooping after about a foot or so, and it needed to stay up for about another three feet.
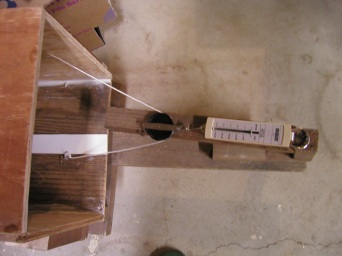
The
last and final method was to simply treat the objects like a kite and try
to fly them in the wind tunnel. This approach required three pieces of
string to be attached to three separate areas on the disc, and then try
to fly it in the wind tunnel.This
approach worked fairly well, although, on some of the readings the ground
friction did come into play. However, the role the ground friction played
was minimal, as the drag force was significant.
Data Collection
Back to
Top
After
a method was finally developed which would allow Robins thesis to be
tested the data was collected
and a graph made of it that would allow for further analysis:
|
Diameter
|
Force
|
|
Area
|
Force
|
|
14.5
|
0.4
|
|
0.008256
|
0.2
|
|
15.5
|
0.3
|
|
0.009435
|
0.15
|
|
17.5
|
0.43
|
|
0.012026
|
0.215
|
|
20
|
0.45
|
|
0.015708
|
0.225
|
|
22
|
0.47
|
|
0.019007
|
0.235
|
|
24
|
0.5
|
|
0.022619
|
0.25
|
|
25
|
0.8
|
|
0.024544
|
0.4
|
|
27
|
0.94
|
|
0.028628
|
0.47
|
|
30
|
1.17
|
|
0.035343
|
0.585
|
|
31.5
|
1.25
|
|
0.038966
|
0.625
|
|
33
|
1.25
|
|
0.042765
|
0.625
|
|
34
|
1.3
|
|
0.045396
|
0.65
|
|
34.5
|
1.5
|
|
0.046741
|
0.75
|
|
35
|
1.2
|
|
0.048106
|
0.6
|
|
37
|
1.55
|
|
0.053761
|
0.775
|
|
42.5
|
2
|
|
0.070931
|
1
|
|
43.5
|
2.1
|
|
0.074308
|
1.05
|
The
results showed that the data that was collected was in fact a linear proportional
equation, which is what was expected, Dfµ
SA. As the area of the discs becomes larger, the drag force on the object
becomes proportionally large as well.
According
to Robins though, the drag force should not only proportional, but also
it should be the same for all objects with the same area no matter the
shape of the object. Squares and right triangles were then created with
the same area to test in the wind tunnel.
Square:
|
area
in cm
|
side
length
|
force
|
|
Area
|
Force
|
|
165.13
|
12.85029
|
0.2
|
|
0.016513
|
0.1
|
|
188.6919
|
13.73652
|
0.35
|
|
0.018869
|
0.175
|
|
240.5282
|
15.50897
|
0.35
|
|
0.024053
|
0.175
|
|
314.1593
|
17.72454
|
0.5
|
|
0.031416
|
0.25
|
|
380.1327
|
19.49699
|
0.55
|
|
0.038013
|
0.275
|
|
452.3893
|
21.26945
|
0.6
|
|
0.045239
|
0.3
|
|
490.8739
|
22.15567
|
0.85
|
|
0.049087
|
0.425
|
|
572.5553
|
23.92813
|
1
|
|
0.057256
|
0.5
|
|
706.8583
|
26.58681
|
1.15
|
|
0.070686
|
0.575
|
|
779.3113
|
27.91615
|
1.2
|
|
0.077931
|
0.6
|
|
855.2986
|
29.24549
|
1.25
|
|
0.08553
|
0.625
|
|
907.9203
|
30.13172
|
1.35
|
|
0.090792
|
0.675
|
|
934.8202
|
30.57483
|
1.3
|
|
0.093482
|
0.65
|
|
962.1128
|
31.01794
|
1.45
|
|
0.096211
|
0.725
|
|
1075.21
|
32.7904
|
1.75
|
|
0.107521
|
0.875
|
|
1418.625
|
37.66464
|
1.98
|
|
0.141863
|
0.99
|
|
1486.17
|
38.55087
|
2.12
|
|
0.148617
|
1.6
|
Triangle:
|
Area
|
Area
of Square for Triangles
|
Height
|
Base
|
Force
|
|
Area
|
Force
|
|
165.13
|
330.2599
|
18.17305
|
18.17305
|
0.25
|
|
0.016513
|
0.125
|
|
188.6919
|
377.3838
|
19.42637
|
19.42637
|
0.3
|
|
0.018869
|
0.15
|
|
240.5282
|
481.0564
|
21.933
|
21.933
|
0.3
|
|
0.024053
|
0.15
|
|
314.1593
|
628.3185
|
25.06628
|
25.06628
|
0.35
|
|
0.031416
|
0.175
|
|
380.1327
|
760.2654
|
27.57291
|
27.57291
|
0.5
|
|
0.038013
|
0.25
|
|
452.3893
|
904.7787
|
30.07954
|
30.07954
|
0.6
|
|
0.045239
|
0.3
|
|
490.8739
|
981.7477
|
31.33285
|
31.33285
|
0.85
|
|
0.049087
|
0.425
|
|
572.5553
|
1145.111
|
33.83948
|
33.83948
|
1
|
|
0.057256
|
0.5
|
|
706.8583
|
1413.717
|
37.59942
|
37.59942
|
1.15
|
|
0.070686
|
0.575
|
|
779.3113
|
1558.623
|
39.4794
|
39.4794
|
1.2
|
|
0.077931
|
0.6
|
|
855.2986
|
1710.597
|
41.35937
|
41.35937
|
1.3
|
|
0.08553
|
0.65
|
|
907.9203
|
1815.841
|
42.61268
|
42.61268
|
1.4
|
|
0.090792
|
0.7
|
|
934.8202
|
1869.64
|
43.23934
|
43.23934
|
1.55
|
|
0.093482
|
0.775
|
|
962.1128
|
1924.226
|
43.86599
|
43.86599
|
1.6
|
|
0.096211
|
0.8
|
|
1075.21
|
2150.42
|
46.37262
|
46.37262
|
1.65
|
|
0.107521
|
0.825
|
|
1418.625
|
2837.251
|
53.26585
|
53.26585
|
1.9
|
|
0.141863
|
0.95
|
|
1486.17 |
2972.339
|
54.51916
|
54.51916
|
2
|
|
0.148617
|
1
|
Once again the results showed that the Drag force is linearly proportional based upon the object area, and the shape of an object does not effect the drag. The linear equation for all three graphs is roughly y = 7.3x, and the R2 value for all three graphs is above ninety-five percent, which suggests that the data collected is very reliable and accurate. They were also similar to the first one for discs.
Problems and Analysis
Back
to Top
circuit wind tunnel. Problems using an open circuit wind tunnel include:
Angle of attack - If the object being tested in the wind tunnel is at a different angle of attack than another object different forces can be apply pressure on the object. Temperature Open-circuit wind tunnels are at the whim of the surrounding environment. On the morning that the objects were tested for drag it was rather could out, about forty degrees Fahrenheit. This can cause the air to be denser, which in turn could contribute to higher readings for drag.
Humidity If the air is humid, which it was on the morning we tested the objects, it can cause the air to be very dense. This, just like temperature, causing a higher than normal reading to be measured.
Pressure The tunnel is once again at the mercy of the surrounding environment. Higher pressure means a higher density of the air, which in turn produces a higher drag force recording. On the day that our data was recorded a small storm was moving through the area so the pressure was a little low, causing the drag recorded to possibly be lower than average.
Air gusts from outside wind tunnel - Open-circuit wind tunnels can be subject to gusts caus[ing] variations in the test section dynamic pressure, and in the distribution of dynamic pressure across the test section, although, it only accounts for a two-percent variation in test section dynamic pressure (Pope, 19). One can eliminate the problem by adding a honeycomb-shaped object into the wind tunnel and mesh screens. We added a honeycomb piece of cardboard, although we lacked screens on our wind tunnel because
they significantly cut down the wind flow in the tunnel. However, we had the benefit of doing the project inside a garage, where the air was relatively still.
Ambient Noise from Fan - Noise from wind tunnel, according to some engineers, can effect wind flow because walls of wind tunnel can vibrate (Pope, 18). Our fan was physically attached to our wind tunnel, and because our fan had a significant wobble to it when it was on, the whole wind tunnel had a tendency to vibrated slightly.
Dust Dust from the surrounding environment can be sucked into the wind tunnel causing turbulence. This was a problem, as there was a significant amount of dust in the garage where we did our testing.
Picture
Back
to Top
Works Cited
Back
to Top
Carlson,
Shawn. "Caught in a Wind Tunnel." Scientific American: The Amateur Scientist.
Nov. 1997
<http://www.sciam.com/1187issue/1197amsci.html>
Glen
Research Center. "Wandering Wind Tunnel."
<http://www.grc.nasa.gov/WWW/K-12/WindTunnel/wandering_windtunnel.htm>
Launius,
Roger D. "Wind Tunnels of NASA" April 6, 1999
<http://www.hq.nasa.gov/office/pao/History/SP-440/ch1-1.htm>
Lego
Design and Programming Systems. TRW Inc."Wind
Tunnel Parts" June 15, 2001
<http://ldaps.ivv.nasa.gov/Curriculum/cheap_tunnel/windpart.html>
NASA
Observatoriam Teachers Guide. "Wind Tunnel Teachers Guide" 1999
<http://observe.ivv.nasa.gov/nasa/educaton/teach_guide/tunnel.html>
Pope,
Alan. Low-Speed Wind Tunnel Testing. Wiley, New York, New York,
1984.
Links
Back
to Top
Wandering Wind Tunnel -Basic information on wind tunnels
Wind Tunnels of NASA -A history of wind tunnels
The Java Virtual Wind Tunnel - A virtual wind tunnel
Caught in a Wind Tunnel: The Scientific American - Information we used for building our wind tunnel.
Direct Simulation Monte Carlo Method -Another Virtual Wind Tunnel