The End Effect
Aaron Cole
Mr. Murray
IB Physics II
21 Jan 2001
Most of the projects done for this physics class have a some real-world importance. Let me be blunt. Compared to the large, bear-like animal of drag-efficiency of new airplane wings or some such thing, my project is the very small mouse which will get eaten up by the coyote which weeds the food-chain of unimportant things. My project really has very little real-world significance. Yes, they probably use the End Effect to calculate the length of some musical instruments, but chances are that they did this already without knowing about the End effect, or sound waves. In fact, I bet they could create some darned good instruments in the time when they still thought that physical ailments were caused by little elves living in people’s stomachs. So. Instead of trying to make a big deal about how much the instrument makers need to know about this which A) I have found absolutely no research on and B) would be darned close to a complete lie as far as I know, I decided to explain basically everything I know about sound, and how it relates to my project. I think my explanation makes sense, but keep in mind, I just only this week learned this, so everything seems new and exciting, and basic. So there may be some over-emphasis on relatively easy concepts. Another note: Because no one seems to care about anything DIRECTLY related to my experiment, like...oh...say....the END EFFECT.....Most of my books deal with the physics of Harmonic Motion, and some with the motion in different instruments. In reality, I could do what I did with three books. But because I need to have more sources.......I have more. Three more have either the same basic concepts that I understand, or complicated ones which don’t directly pertain to my question. So in reality, the use of quotations is only a vain attempt to fulfill the requirement to have five sources. If you have any ideas of how to find anything else on the End Effect.....Well, thank you. And in reality, It isn’t as bad as I just made it sound. Most of it is my interpretation of what I’ve learned[1]. So here goes nothing: Now go on and enjoy it!
In order to explain what the “End Effect” is, first one must understand how wobbling things make music. Picture a drum. Now hit it with a drum-stick in the center[2]. You just caused the drum to wobble up and down. When the drum wobbles outward, it compresses the air, and when it wobbles inward, it depresses the air (Giancoli 290).
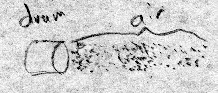
In following the wobble of the drum surface, you maybe find that it follows a pattern very much similar to that of a buoy bobbing the water, or the lunar cycle or the movement of planets, OR in other words, a “periodic motion that is a sinusoidal function of time” (Rigden 1017) (Parker 527). It is periodic because it repeats the motion, and it is sinusoidal because.....well it just looks sinusoidal. And it’s a function of time because the drum is either in or out or somewhere in between based on what time you look at it. Drums, however, are not what we are looking at. This example only matters in that sound is created by the air being vibrated by something else vibrating, and that she shape of the sound is sinusoidal.
Now moving on to vibrating strings.
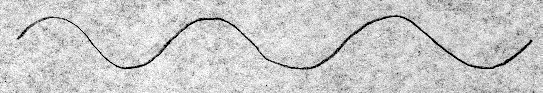
Once more, I shall not quite get to the point of my project, and divert your attention to how a string can create sound. Picture a guitar. One of the old-fashioned ones, not the electric ones. Much better. Now pluck a string. It makes a noise, yes? The sound is coming from the string you plucked, which is now vibrating. Yet the vibration is (dare I say “obviously?) not entirely a random jumble of pieces of string bouncing every-where. (Strassenberg 20) There is a pattern, since the pitch of the note stays relatively the same over the time it produces it, and if the string were to be jumping around randomly without a pattern, the air would be compressed and decompressed at random places at random times at random forces. With all these variables acting independent of each other, there would obviously be no consistent sound. And yet we get a single, consistent pitch coming from the string. To explain this, I will ask you to picture yet another....well....picture. Picture a piece of string attached at one end to the wall, and at the other to your finger. Now picture wiggling your finger to create a wave in the string[3]. Now wiggle your finger more[4]. Notice how some of the new waves you create interfere with the old ones coming back? Now wiggle your finger at a constant speed so that the waves going to the wall meet the waves coming back to create a pattern something like the one right HERE[5]:
When strings on a guitar vibrate like your (imaginary) string just did, the random vibrations get in each other’s ways and quickly cancel themselves out, leaving only a single pitch coming from the sting. This is done through a highly complex process[6]. The formula for this is:
f = v/2L
That is, frequency (the pitch) equals the velocity of the wave on the string, and L is the length of the wave on the string (Giancoli 319). As you can see, if you decrease the length of the string L, then you increase the frequency f, thereby creating a higher pitch.
Now, ALMOST to the juicy part. So now you can picture a row of Coke[7] bottles (Except they are straight. So....almost like Coke tubes of the future. OK. Maybe it looks more like PVC piping, but Coke bottles sounds more colorful.) filled with different amounts of water. You blow in them. They create different pitches. But there’s no string inside of them! So what is vibrating?[8] The air inside the tubes is what’s vibrating. Yet “in the closed organ pipe, only those vibrations can exist in the air column which have a node at the closed end and an antinode at the open end” (Semat 110). This means, that instead of the vibrations looking like this:
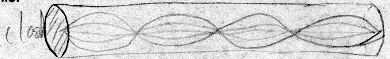
They look like this:
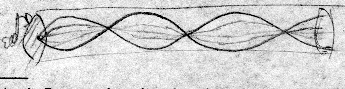
That’s right, the closed organ pipe is half as long, yet creates the same pitch. This is for some highly scientific reason.[9] Now to squash everything you’ve learned together. Remember how you could use f = v/2L (actually, it’s f = v/4L now because the pipe is closed on one side) to find the pitch (frequency) in terms of the velocity of the sound wave and the length of the object vibrating (Semat 111)? Well, when you attempt to apply this formula to pipes, you find that you need just a little more length on the pipe to make the formula work. Every time, you come up short. This is because of a phenomenon called the “End Effect.” Recall how in a pipe organ, it is the actual air which vibrates and creates a pitch. As it turns out, the air which vibrates actually extends some distance beyond the end of the pipe. Through experimentation, I intend to find the relationship between the length of the End Effect, and the radius of the tube. I expect to find that this relationship is
r=.01e
where r is the radius and e is the “length of the “end effect.” I base this off of some very scientific ideas which I choose not to discuss at the time[10].
First of all, let me say that I used some very scientific instruments in my set-up. Then let me say that these highly scientific instruments really cheesed me off with their ability to perform in an unscientific way[11]. Then let me say that I also used some specifically NOT scientific instruments. Like the toilet-bowl seat. (I don’t THINK it was ever on a toilet. Probably not.) And the large amounts of duct tape. Before the duct tape, there was string. I guess there still is, but that’s another story for the next paragraph. And then there’s the chair with enough cat hair to stuff a pillow. And the pieces of firewood used to hold stuff up. But all this was better than the original idea, which I don’t think I’ll really explain because Mr. Murray was really the one who told me not to do it that way. So it really had very little scientific thought on my part. So.
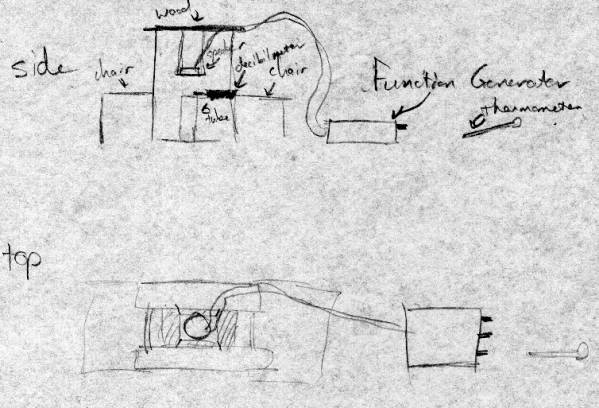
You guessed it! This is the set-up for the project. I will now be repetitive and tell you what materials I used in the creation of this lab:
2 Chair-type things. Really, they don’t have to be chairs. They just have to hold the poles who hold the speaker above the tube.
2 Pieces of wood. They don’t have to be wood. The important thing is that they are long enough to span the two chair type things.
1 Roll of Duct Tape. No physics project should be without one. Heck! No project should be without one! “Together holding the universe it does” says Yoda.
1 Speaker. It should work with the
1 Function Generator. This is important. Not that the other stuff isn’t.
1 Set of wires. You sorta need them. They aren’t any normal wires. They are specifically the wires that go to the Function Generator. Yes, most people would just assume that those are included in the Function Generator. But I’m not. Who knows? Maybe when the earth is destroyed, and this is the last of the documents recovered by the aliens -- who can read English but need my help to figure out this scientific concept -- maybe they wouldn’t get any wires if I didn’t tell them to. Or maybe I’m just feeling like a smart-alac today. Oh ya. That’s it. Never mind.
1 Decibel-Meter. It’s important. We really can’t figure out when the tube is resonating a pitch without it. Because we’re really bad at figuring stuff like that out. Our ears aren’t that good.
1 Overhead roller thing. You cut a section off and turn it into a tube with varying diameters, which you manipulate using duct tape.
1 Thermometer. It tells the temp
1.) Come up with a plan
2.) Figure out another one, cause the old one wasn’t so hot
3.) Repeat steps one and two as many times as necessary.
4.) Research what you’re doing. In my case, I really didn’t know too much about this in the beginning. And by knowing not “too much” about this, I mean ABSOLUTELY NOTHING.
5.) Construct set-up.
6.) Encounter problems
7.) Move set-up location
8.) Change set-up plan
9.) Encounter Dog
10.) Move set-up again
11.) Get data (the important part)
A.) Tape overhead plastic stuff into a cylinder.
B.) Measure diameter of cylinder
C.) Record diameter. Except as the radius. So remember to divide by two.
D.) Set the tube pointing up directly to the microphone part of the Decibel-meter
E.) Turn on the function generator (of doom).
F.) Cringe, because although it might not be too bad at first......it’s like that Chinese water torture where they keep dropping the water on you repetitively. Well after a while, this noise too could kill.
G.) Fiddle with the large frequency changing knob first. Move it very slowly starting from perhaps 327ish.
H.) No! Slower! Now look for when the decibel-meter spikes. You have to go very slowly, because it’s easy to miss it.
I.) Now that you found about where it spikes, you have to use the small satanic knob of doom and stupidity. Don’t press it in. That puts the frequency down about 3 Hz. And when you let go it goes back up. And don’t move it too slowly, or else it won’t move. And don’t move it around too much. Move it, and then wait about two seconds to be sure. Sometimes it takes both the decibel-meter and the function generator about that long to decide what they want to tell you.
J.) Move it around until you have the frequency that matches the spike. Sometimes you get a range, because the decibel-meter isn’t that accurate, and so your spike might be from....say.....234-239Hz.
K.) Write it down.
L.) Turn off function generator
M.) Rub ears. Ow. Don’t they hurt? If they don’t, you aren’t doing it right. Or you’re deaf. In which case one might wonder why you chose a project on sound.
N.) Check the temperature. Record.
O.) Repeat steps A-N many times.
P.) P for “Oh POOP” when you find out that some of the spikes you get keep re-appearing. Like 283. Go back, and when you do more, realize that when you get a spike at 283, it’s probably not what you are looking for.
13.) Create the spreadsheet to make the calculations for you. Here’s a piece of the spreadsheet with the equations explained. I will then be repetitive and explain how I did it:
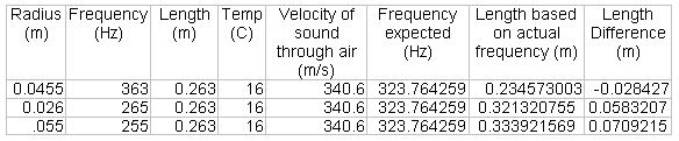
Explaining how we get these strange #s:
A.) You record the radius, frequency used, and the temperature in the appropriate columns. (the first, second, and fourth, in case you couldn’t tell.) Also copy the same length onto all the block things in the length column. A roll of overhead plastic stuff isn’t like us. It doesn’t shrink with age.
B.) Now look! #’s Pop up! Magic! But not quite! What actually happened was that all of those #’s effected other ones. Here’s how:
1.) The velocity of sound through air is based on the temperature of the air. The equation is V = 331 + .6 * T. In excel, this is written as =331+(0.6*E2) with E2 being the box with the temperature.
2.) The equation for the Expected Frequency (based on the length of the tube and the temp of the air) is f = V / (4L). In excel this is =(F2/(4*D2)) with F2 the velocity and D2 the length of the tube.
3.) The equation for what the length should be based on the frequency is simply a reversal of the frequency function directly above. It is L = V / (4f). The manifestation of this in excel junk is =(F2/(4*C2)). I just DARE you to guess what C2 is.
4.) The last step, finding the length of the end effect, is simply the difference between the longer of the two lengths and the shorter. (The calculated length - the real one.) A funny note that wasn’t really funny at the time: When the spike you get is above the calculated frequency, then you get a smaller length than the actual one. Which isn’t exactly consistent with the idea of an end effect. I mean, it WOULD be an end effect. Just the opposite kind. And in truth, it doesn’t really work that way. Oh. And when you barf it out of excel, it’s =(H2-D2). Once again, I think that you can figure out what H2 and D2 stand for. And if you can’t, then I feel very confident in insulting your intelligence. Haha!
So that’s why THAT works.
13.) Graph the stupid thing. Find a graph that fits it quite nicely. Don’t question Mr. Computer.
14.) See a point that obviously doesn’t fit in the graph. Figure out what went wrong there. It is either:
A.) It’s one of the satanic reoccurring frequencies
B.) You put too many or too few zeros in the equation for the radius....HEY! It’s hard work converting cm into m.
15.) Exorcise the demon from your graph.
16.) Do the write up. Yes. Isn’t it amazing how we’re technically still on the “Method”?
Firstly, I want to discuss how the experiment works. Now that we all know what to do, I want to explain HOW it works. I have discussed it sorta spaced out, but I want to spell it all out in one section so there is no confusion. In the simplified sense, pipes resonate a certain pitch we can determine using an equation. So when we go from the other end -- that is, we find the frequency that resonates through experimentation -- and then work out what the length should be from that, we continually get a length longer than what I obviously have. So then we just find the difference. What the decibel-meter does is, is that when the tube resonates, it makes more noise, and the decibel-meter tells me when it makes more noise. So when I know it’s making more noise, I know it’s resonating, and I know the frequency it resonates at, and then I know the length the tube should be. Yup.
Wooohooo! I made it this far! And we ain’t done yet! When I get done, I get a graph that looks an awful lot like this.
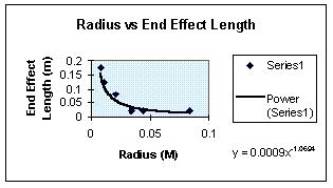
A smart person might comment that it looks like this because it IS the graph that I got. Or a copy thereof. But anyways. I picked the “Power” function to be the one which matches the graph simply because it......touches the points better than any. Here’s the alternatives:
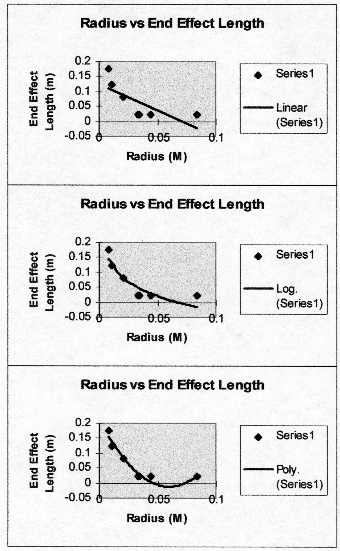
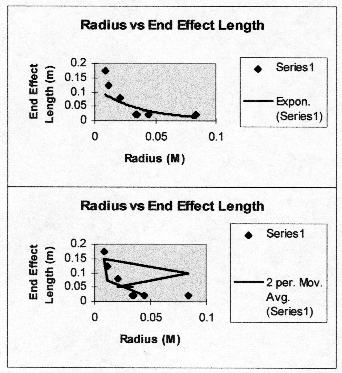
These obviously don’t work. Especially that last one....I REALLY don’t get what that thing thinks it’s doing.
My first problem was that I couldn’t find out when it was resonating, because it was too soft, and my ears aren’t that carefully tuned. This was solved handily by the Decibel-meter, which, when placed above the tube, gave me a feel for when it (or something else, as was often the case) resonated. The next problem was the one which haunted me to the end: The resonant frequencies of the rooms. I after conducting this experiment, I am convinced that every room has a resonant frequency or five. At first, when I continued getting the same frequency for vastly different radii, I believed that my tube was simply not resonating like it should have, due to random amounts of air waves escaping through the unsealed connection between the bottom of the tube and the ground. To solve this, I used the toilet-bowl. I set up a toilet bowl so it was above the ground, and had rubber bands stretching in the center in such a way as to (more of less) hold upright a tube in the center. Then I proceeded to find frequencies using the equation of f = V / (2L) for an open-ended tube. This worked OK. But I still ran into the problem of the repeating frequencies, even after I had moved into the living room, which had softer surfaces (carpeting and a couch) which I assumed would reflect sound less than the concrete and wood garage. Though this might have helped a small amount, it did not help enough. Plus, the dog had to come inside some time. So I moved to my room. In my room, I was largely successful in gathering the data I needed. It was in my room (after about gathering about three data points which took about an hour total) that I got completely fed up with the toilet-bowl-rubber-band method, and I decided to give the “closed tube” thang another try. This worked all-right, so encouraged, I got many more data points this way. Another problem which seemed to creep up was what to put under the tube. It needed to be something which would not suck up the sound I was counting on to resonate, yet something which would not allow large amounts of sound waves to escape through the bottom, and create yet another way to mess all my findings to heck. I ended up using this binder which has a small amount of cushieness, but is pretty solid -- and as a side-note, I keep my dreams in it.
So if I haven’t mentioned it already, the main problem which I had been running from all along but which I really could never escape was the natural resonance in whatever room I did the experiment in. The sound produced by my piddly tube really is very little, and just like a certain shape of tube makes a certain pitch because the sound bounces in just the right way.....so does the room, to some extent. I would HYPOTHESIZE that certain shapes of objects bounce off certain pitches louder than others. And that the reason for the multiple peaks which were not the resonance of the tube were due to certain objects’ resonance. These “certain objects” were probably the ones which were positioned to bounce the sound back at the decibel-meter, and thereby have the most direct effect. Therefore, the best way to do this test would be in a room with infinite space around the test stuff.
I believe another factor in why the spikes cause by the “room stuff resonance” and the resonance of the tube is that the tube I used was made from highly used overhead stuff. It was dented, scratched, et. For sound to bounce around happily, it wants a very smooth surface. Without that, it takes longer to settle into it’s little pattern (frequency). So I think the imperfections in the surface of my tube led either to the messing up of the results for what frequency was used -- As if that needed more things to mess it up. I think it is a miracle that so many data points appear to be real ones -- and/or took down the ability of the tube to produce a loud resonating sound. Problem is that there really are very few alternatives. Everything has some degree of imperfection, and if I use different materials on each test, I introduce even more variables to the experiment. So......it’s probably the best under the circumstances.
There are two main things which could contribute to uncertainty. One is the radius of the tube. Since it is hard to get a perfect circle, and the shape of the mouth is usually bending slightly to one side of oval or the other, it is a challenge to get the exact radius. Almost every radius was estimated in this manner. More liberty was taken with the larger radiuses than with the smaller ones, the smaller ones being easier to hold in one place and position, and therefore easier to measure. When you facter the minute amount I might have been off by, on the radius, however, you find it matters very little. The other area where there is some definite uncertainty is in the frequency. Even in the frequencies which were collected and deemed to be correct, many used the average of a range of frequencies which all caused the same reading on the decibel-meter. The general spread of these seems to be 2Mh one way or the other. And since our measuring instruments aren’t THAT powerful, we really can’t know where in the range the peak was. So now I will attempt to create some uncertainty stuff for you! Here goes nothing!
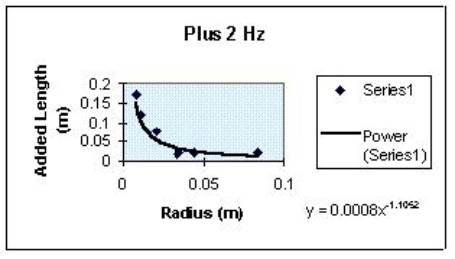
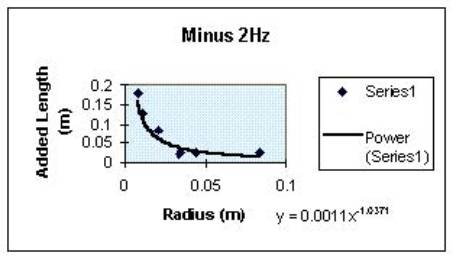
So basically, my hypothesis was wrong in every way. I predicted that the graph would form a linear relationship between the radius and the end effect. Wrong. It produced what appears to be a “power” graph, or one where it’s in the form bx^a or something. I also predicted that the length of the end effect would increase with the diameter. Nope! As it turns out, as the diameter gets smaller, the end effect gets larger. A lot larger. If it continues to follow this trend, eventually (with a small enough diameter) the pitch that it resonates goes out of the human capacity for hearing, which, generally speaking, goes down to about 20Hz (Giancoli, 310). If you work it out, you find that, for the length of tube I worked with, you would need about a .000385m radius before you go out of our hearing range and (conceivably) into the range where it starts becoming harmful to the human body. (In reality, if the speaker can produce the frequency without doing me great harm, what little resonance I may get from the tube will do basically nothing more.) If, however, a longer tube was used, say......two meters high, the radius would be much more realistic. Here’s the math, yo! It’s all written out because that is so much clearer for you, and easier for me!
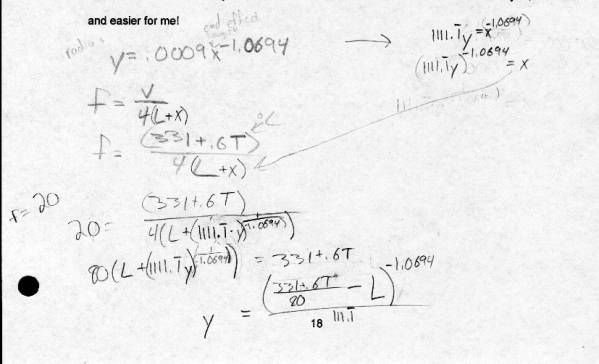
Well. Maybe it’s not easier for you…..but it was sure a heckuva lot easier for me.
Well, I basically said everything I wanted to already. It was hard to get data points that were correct. But they were gotten. And strangled. And tamed. The uncertainty was purdy big. But that’s only because of the equipment, really. If the equipment were upgraded, smoother, more uniform surfaces were used for the tubes, and larger matter-less areas were usable for the experiment, it would make life easier. Yope Well, that’s about it. And it’s about time!
Giancoli, Douglas C. Physics: Third Edition. London, England: Prentice-Hall International (UK) Limited, 1991.
Parker, Sybil P. McGraw-Hill Encyclopedia of Physics: Second Edition. New York: McGraw-Hill, 1993.
Rigden, John S. Macmillan Encyclopedia of Physics. New York: Simon and Schuster Macmillan, 1996.
Semat, Henry. College Physics; A Programmed Aid. New York: Hold, Rinehart and Winston, inc. 1967.
Strassenberg, Arnold Adolph. The Guitar: A Module on Wave Motion and Sound. New York: McGraw-Hill Book Company, 1975.
A good site to generally explain sound and it’s relation to music….which is basically the only “real life” use for the end effect. I think it was made a while ago, because the entire thing is text, with the images available only through links. But whatev.
http://www.silcom.com/~aludwig/musicand.htm
A purdy cool animation of how sound waves move through air. Though not entirely exactly pertinent to my project, none of these are, and this is probably the most amusing. You can also change the speed of the little dots or the waves or something while it goes. Purdy cool. Thanks Northwestern Uni.
http://www.physics.nwu.edu/ugrad/vpl/waves/sound1.html
Another cool demo, this time, of longitudinal waves verses sheer waves. Though once again, it has little to do with my project specifically, it’s nifty. Thanks to the Center for Nondestructive Evaluation at Iowa State University. Non-descriptive Deity or Greater Power knows why they only do the not fun kind of evaluation, but we’ll let them be for now.
http://www.cnde.iastate.edu/ncce/UT_CC/Sec.2.4/Sec.2.4.html
Good intro into sound waves --
http://www.glenbrook.k12.il.us/gbssci/phys/Class/sound/soundtoc.html
A magazine.
I think it’s an entertainment magazine.
But the site is swaves.com. And
it’s called “Sound Waves.”
Some people who sell stuff – But once again with a great domain
name.
My final and most serious link – From the Genetic Science Learning
Center. It’s their thing on deafness,
and how sound works. It’s got some nice
pictures. I love pictures.
http://gslc.genetics.utah.edu/thematic/deafness/hearing/sound/index.html