The Effects on the Erosion of Topsoil Caused by Obstacles
Embedded in the Soil
| A Project by Lauren Bly
|
Table of
Contents:
I. Introduction
Erosion can be defined as to wear away (Foth 374). The erosion of soil is the general wearing
away of soil and rock from the earth’s surface, and the transportation of this material,
by means of moving water, wind, ice, and temperature variations, to name a few
methods. It naturally shapes the land
by wearing down mountains and other land forms, and also carrying soil to other locations to be used to form new
land forms and increase the size of others.
This process tends to bring the surface of the earth to one, uniform
level, over time. An example of this is
the Appalachian Mountains, which now stand at about one-half their original
height (Foth 375). This process is generally
a slow one, occurring over thousands or millions of years. The gradual manner of erosion helps preserve
an environmental equilibrium, by bringing more nutrient-rich soil to the
surface and covering the more weathered, less nutritious soil. However, as with many other aspects of the
environment, human activities have altered the erosion process in many areas of
the globe, causing problems.
The top layer of dirt, called the topsoil, is vulnerable to erosion via
human alterations to the environment, such as agriculture, forestry, and
construction. Different land uses cause
soil disturbances, and this causes erosion to occur far above natural
rates. Erosion of the topsoil is
harmful because the layer of dirt under the topsoil does not contain the nutrients
that the topsoil does, and so plants have a hard, sometimes impossible, time
growing in places where there is low or no topsoil. Also, removing the topsoil
greatly reduces the soil’s ability to regulate water flow and prevent pest and
disease infestations.
Naturally, erosion control is assisted by the presence of plants and
trees, which shield the topsoil from wind and rain. The roots of these plants and the waste material, such as dead
leaves and fruits, stabilize the soil by acting as an anchor and helping
to keep the topsoil in place.
This experiment, using nails in substitute for plant roots, will
investigate the change in the amount of soil eroded, measured by the volume of
soil that is moved out of the box, due to the number of nails in the setup in
each trial, measured by number of nails per square centimeter. It is predicted that the more nails in the
trial, the less soil will erode out of the box.
II. Setup
|
Materials
Used: Potting Soil Measuring Containers with
Liters Soil box with PVC pipe
attached Funnel Water Nails (Used 3 ½ inch nails) Pan for catching soil and
water Yarn Ruler with centimeters |
|
|
|
The Soil Box with
PVC Pipe |
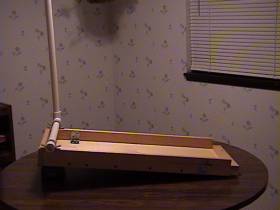
The setup for experimentation was of
unique design. The box was designed to allow
for experimentation with running water in a uniform manner, so that conditions
would be a better replica of what occurs in nature. The box held potting
soil, and
water was poured into the PVC pipe using a funnel so as not to spill the
measured amount of water. The water
flowed through the tube to the horizontal portion, where little holes were
bored into the pipe in the bottom. The
water came through the little holes onto the soil in a uniform manner. The box was tipped at a 20° angle, so that the water ran down over the soil into a container at
the end of the box.
The box was divided into sections,
with each section containing 287 square centimeters, and marked off with pieces
of yarn stapled into place. As the
trials were being run, and as more nails were needed, they were hammered into
the bottom of the box, with most of the nail still remaining above the wood at
the bottom of the box. Trials were run
with a certain number of nails per section of 10 centimeters by 28.7
centimeters.
The method used to conduct this investigation consists, in short, of
two pre-trials, and the experimental trials.
After the setup was put together, two pre-trial runs were performed to
make adjustments in the setup and establish which constants were needed for the
experiment to work correctly. Then,
after all the adjustments, the trials were run one after another, and the data
for each trial was recorded. After each
set of three trials with the same nail count, more nails were added. There were
24 trials run, three for each of the different amounts of nails in the
experiment. In each pre-trial and
trial, fresh potting soil was used that was dry and had not been used before. After potting soil was used once, it was
disposed of and not used in another trail.
Two pre-trials were conducted before the trials in which data was collected. The purpose of these trials was to guess and check the amount of soil and water needed to produce measurable results, and to make sure that the setup functioned as anticipated.
During the first pre-trial, the box
was filled with soil to the halfway mark, which had been measured and marked
with ink pen during the construction of the box. .5 L of water was poured into the tube. The result was that the majority of the water was absorbed by the
soil, and no runoff was noted. Also,
the water tended to flow to one side of the box. To correct these errors, a level was used to make sure that the
box was level to prevent the water collecting at any one side, and the amount
of 500mL was noted to be not enough water.
However, the soil level proved to be just right and the half way mark
was deemed a constant for the experiment.
The second pre-trial was conducted
with the same amount of soil as the first, but with 1 L of water. This amount of water produced results, as
soil and water ran out of the box, and 1 L became the water constant for the
experiment. The water flowed evenly
across the soil, and so the level problem was corrected.
Each
of the 24 trials was conducted using the method mentioned in the Setup and
Method sections. Water was poured into
the pipe, and flowed over the soil and created water and soil runoff. The runoff was collected in a pan at the
bottom of the box. This runoff was
poured into a measuring container.
However, because part of the runoff was soil particles, much of the soil
did not flow off the pan into the measuring container. To remove the rest of the soil, a measured
amount of water was used to wash the soil from the pan to the container. This value of water needed to wash depended
on the amount of soil stuck to the pan, and so was not always consistent
because sometimes more water was needed.
This particular volume of water, whatever it happened to be, was
subtracted from the volume measured during the calculations. The measured volume of water was recorded,
and then disposed of.
After each trial, the wet soil was
removed from the box. All the measuring
containers (the pan, the container to measure volume) were washed with water to
remove any remaining soil. Then, if
more nails were needed, they were added at this time. To add them, the nails were hammered into the bottom of the
box. This prevented them from coming
loose during the trials.
The constants and variable used in this experiment are as follows:
Table A: Constants and
Variables in the Experimentation
|
Water Used |
Soil Used |
Area of Sections |
Dimensions of Box |
Nails Used |
|
1 Liter |
Halfway filled box |
287 square cm |
28.7 x 60 cm |
Varied 1-4 per section |
The results of each individual trial are listed in Appendix i. The resulting volume of runoff shown in Appendix i was calculated in this manner:
Total amount of soil minus the volume of = the
volume of
and water measured water
used to wash runoff for
the
the pan off trial
From the three trials tested for
each amount of nail per 287 square centimeters, the average volume of soil and
water displaced was:
Table B: Average Volume of
Runoff in Trials
|
# of Nails |
0 |
1 |
1.5 |
2 |
2.5 |
3 |
3.5 |
4 |
|
Volume of Soil |
.58 L |
.72 L |
.42 L |
.52 L |
.48 L |
.45 L |
.45 L |
.40 L |
At first glance, the data of the trials
does not appear to have any meaning or show any correlation or decisive results
from the experiment. However, by
examining the averages of the three trials in each nail count, a small pattern
can be seen in the data.
The data of the individual trials
does not prove much by itself.
Throughout the trials, there is a great variation among trials of the
same nail count. There were some trials
that produced surprisingly low runoff volumes.
This was due to when the all the water ran to one side of the box
unexpectedly, and created a dam for itself, and keeping most of the soil in the
box. Because of these trials, the
patterns in the data are dampened and hard to determine.
By taking the averages of the
trials, as shown in Table B, a pattern can seen. From one nail to four nails, the volume of soil runoff shows a
decrease. This decrease is not linear
or consistent, but is there all the same.
The trials with higher nail counts had less runoff than the trials with
lower nail counts, enough difference in the nail count to conclude that the
nail count affected the runoff value.
One would expect the trials with no nails to displace more water than
the trial with one nail, but proved not to be correct. This was because once the first nails were
put in the setup, they changed the flow of the water over the soil. The water with no nails traveled over more
area and spread itself out, allowing for more opportunity for the water to be
absorbed by the soil and stay put. Once
the nails were included, the water had obstacles to move around, and so more of
the water stayed together and provided a force to move the soil. This is why the amount of soil moved in the
no-nail trials moved less water.
The uncertainty of the experiment, due to the variation in values among
trials of the same nail count, is somewhat high. The highest variation between values is .5 L, as seen in the 1.5
and 2 nail trials.
Because of the trend seen in the
mean values data, in Table B, the hypothesis is proved to be correct. Even though the pattern is not exactly
consistent, nonetheless the pattern is there that the more nails, the less soil
eroded out of the box. Therefore, the
nail count affected the runoff value in a noticeable way, as expected.
For the most part, the experiment was conducted exactly as
planned. No problems other than the low
values came up, and the data fit with the hypothesis. However, because of the uncertainty of the experiment, the
experiment was analyzed and some factors were discovered that may have
contributed to the uncertainty. These
factors that may have contributed are: the patterns in water distribution, as
discussed before, that produced low runoff values, the method used in the
experiment, and the materials used in the experiment. Each of these factors would need further experimentation to prove
or disprove that they were a contributor to the uncertainty.
As mentioned before, the trials in which the water gathered at one side
caused a variation in measured volumes of runoff. This is thought to be the only major cause of uncertainty. Although the cause of this problem is not
exactly known, there are suggestions as to factors that may have contributed to
this problem. These factors are
included above in the hypothesized causes for uncertainty; they are the method
used to conduct the experiment, and the materials used in the setup. By the method of the experiment, it is meant
that the measuring of runoff was measured with both water and soil mixed, and
may not be accurate. By materials used
in the experiment, it is meant that the materials that the box consisted of or
the potting soil may have caused inconsistencies in the experimentation.
The method of the experiment
might have indirectly caused the uncertainty by causing the problem with the
low volume data values. This is
possible, due to the fact that runoff was calculated using both the water and
soil that ran out of the box. It was
discovered early in the experimentation process that the easiest way to
calculate the runoff would be to measure the volume of both the water and soil
that ran off out of the box. However,
the amount of water that ran out of the box each time changed, due to
absorption into the soil, and it was impossible to measure how much water was
absorbed in the soil still left in the box.
The pattern of flow in the box varied in each trial, and so the amount
of soil that the water encountered was different each trail. In order to rectify this problem, a few
assumptions were made. First, it was decided if a variation in the data
occurred if in one trial, the absorption of water into the soil that remained
in the box was significantly different than in another trial, this variation
was negligible. It was also decided
that the water that ran off with the soil would be measured and considered an
important part of the erosion problem, since water that is absorbed into the
soil rather than run off makes that soil healthier. It is suggested that at another time it could be investigated
whether or not these assumptions significantly altered the data to this
investigation, and that another experiment could be conducted taking into
account and somehow measuring accurately both the absorbed water in the soil
that remained in the box and measuring only the soil particles that ran out of
the box.
The volume of both water and soil that was calculated represents the
amount of topsoil that would be eroded, and the amount of water that was not
absorbed into the soil. For soil to be
healthy, topsoil must be in abundance and water must be there to help nurture
plants and other life. When both are
removed in great amounts, the soil is less healthy and life cannot flourish in
those areas.
The materials used in the experiment may have contributed to the
uncertainty by influencing the absorbency of the potting soil used at different
points during the experiment. The box
was made of wood, and wood absorbs water, so it is possible that during one
trial the wood became wet and caused in the next trial for some of that moisture
to pass into the dry potting soil before the water was even poured onto the
soil. This may have, in some way,
caused the soil to react differently with future trials, in a disruptive
manner. Looking at the data from the
trials, the occurrence of low volume data points does not appear to be
different in the earlier or later trials, but who is to say whether those low
volume trials were caused by low nail counts and would have died off and not
appeared in later trials had the wood not added moisture to the soil. It is purposed that this experiment be
repeated, but with a non-absorbent material used in the construction of the
box, so that moisture does not escape the soil.
Careful planning was put into this
experiment to create an event (the experiment) that replicates what occurs in
nature when great amounts of water flow over topsoil that does not have any
protection from roots or plants. The
earlier trials represent soil that has almost no cover or anchor, and the later
trials represent soil that has some anchorage.
As the results of the experiment show, it is better to have more cover
for topsoil, and that every bit of anchorage helps both preserve what topsoil
is there, and also to hydrate the soil and make conditions favorable for
more plant
life to grow. By having some anchorage,
soil can repair itself by getting more and more hydrated, and nurturing more
and more protective plant life.
From this experiment, suggestions
can be made to preserve the health of the environment. This experiment has shown that even a little
bit of anchorage for soil is better than nothing, and that if given even a
little bit, soil can regenerate and heal.
Erosion occurs most frequently in agriculture and building sites, and if
more precautions were taken at these locations to control erosion, especially
with heavy rainfall and water flow, these areas would stay healthy. It is important to preserve that health of
our soil, because the quality of the environment depends on it.
-
Erosion and Soil Degradation: http://royal.okanagan.bc.ca/mpidwirn/agriculture/erosion.html This page contains detailed information about erosion and causes, especially the human component, and what can be done to decrease harmful erosion. This is the best summary page that I have found.
-
U.S. Global Change Research Office Page: http://www.gcrio.org/geo/soil.html This page contains a good description of what erosion is and what causes it. It's a good start for understanding erosion.
-
Corn, Soil Tillage, and Erosion: http://www.ontariocorn.org/envsoil.html The corn page has information about crops on soil and how plant life prevents erosion, and how the soil health affects plant health.
-
Soil Erosion and Residue Management: http://ozone.crle.uoguelph.ca/manure/soil.management/soileros.html This page contains information about the effects that farming has on soil and erosion rates.
-
Soil Erosion in Agricultural Systems: http://www.msu.edu/user/dunnjef1/rd491/soile.htm Another page on soil erosion, this page adds a few new things to what the above pages cover.
-
Types of Erosion: http://danpatch.ecn.purdue.edu/~epados/erosbmp/src/types.htm This page has information on all types of erosion, not just soil, and provides links to more erosion information.
Appendix i : Data of Trials
1 to 24
text version
|
Trial |
Number of nails per 287 sq. cm |
Measured Volume of Soil and Water |
Minus Amount of Water Used |
Total Volume of soil and water |
|
1 |
0 |
.75 L |
.20 L |
.55 L |
|
2 |
0 |
.60 L |
.20 L |
.60 L |
|
3 |
0 |
.80 L |
.20 L |
.60 L |
|
4 |
1 |
1 L |
.20 L |
.80 L |
|
5 |
1 |
1 L |
.25 L |
.75 L |
|
6 |
1 |
.80 L |
.20 L |
.60 L |
|
7 |
1.5 |
.75 L |
.20 L |
.55 L |
|
8 |
1.5 |
.35 L |
.25 L |
.10 L |
|
9 |
1.5 |
.80 L |
.20 L |
.60 L |
|
10 |
2 |
.95 L |
.20 L |
.75 L |
|
11 |
2 |
.50 L |
.25 L |
.25 L |
|
12 |
2 |
.75 L |
.20 L |
.55 L |
|
13 |
2.5 |
.85 L |
.20 L |
.65 L |
|
14 |
2.5 |
.45 L |
.20 L |
.25 L |
|
15 |
2.5 |
.75 L |
.20 L |
.55 L |
|
16 |
3 |
.70 L |
.20 L |
.50 L |
|
17 |
3 |
.55 L |
.20 L |
.35 L |
|
18 |
3 |
.75 L |
.25 L |
.50 L |
|
19 |
3.5 |
.70 L |
.20 L |
.60 L |
|
20 |
3.5 |
.65 L |
.20 L |
.45 L |
|
21 |
3.5 |
.50 L |
.20 L |
.30 L |
|
22 |
4 |
.60 L |
.20 L |
.40 L |
|
23 |
4 |
.70 L |
.20 L |
.50 L |
|
24 |
4 |
.50 L |
.20 L |
.30 L |