Why
Is My Toilet Seat Wet? : An In Depth
Study of Water Droplet Displacement
by Stefanie McDougall and Brian Murphy
Background Information | Statement of Problem | Hypothesis | Procedure | Results | Data Analysis | Conclusion | Links
Background Information
Life on earth is one lived constantly surrounded by fluids (USC). The air we walk through and the water we drink, which makes up 80% of our bodies, comprise the fluids in our daily lives. Therefore, the study and understanding of fluids and their mechanics is imperative to solving many everyday problems.
According to the USC Department of Aerospace Engineering,
the characteristics of fluid will never be completely understood. However, this challenge will not deter two
excited and brilliant young physicists from pursuing their desire to unravel
the enigmas of fluid dynamics.
As Douglas C. Giancoli observes, liquids are not readily
compressible, and their volume can be changed significantly only by a very
large force (Giancoli 237). One might
wonder how much force is necessary.
Every day, we see large volumes of water, or other liquids, broken into
smaller volumes, such as when water splashes.
For example, when one pours water into a glass, small splashes proceed
to erupt from the water. Many believe
that there is no pattern or method to the madness of these droplets, however,
fortunately for this world, our two young TuHS students beg to differ.
The purpose of this study is
to successfully determine the pattern of such water droplets. When the force of gravity pulls a stream of
water down, some physical characteristics of the water, namely the volume, are
changed. How is this water
dispersed? Is an equal quantity of
water displaced in all directions and all distances? Or is there a distinct pattern of varying volumes within
different radii?
If we drop a controlled stream of water into a cylinder containing water, then we will be able to measure the volume of water “splashed” off at varying radii around the cylinder. If we do this, then we believe a pattern will emerge in which greater volumes of liquid will splash closer to our cylinder and smaller amounts the further away.
Procedure
In order to begin our experiment, we needed a device that would produce a constant stream. To do this, we used a 32-ounce plastic container. We first sawed off the bottom of the bottle, so that during the experiment we would be able to keep the stream from “glugging,” and variables such as the amount of water in the container could be kept constant throughout the experiment. Secondly, in order for the bottle to release a stream large enough to produce splash droplets, meanwhile being small enough to avoid a deluge resulting in loss of control, high uncertainty, and poor data, we drilled a hole in the cap of the bottle. In order to drill this hole, we used an electric screwdriver with a 1/8-inch drill bit in place. After the hole was made, we placed the cap back on the bottle and filled it with water, placed it upside down, and observed the stream. However, we felt that the stream flow was too small. Using a 3/8-inch drill bit, we expanded the radius of the opening. Again we observed the stream, determining that the stream intensity was ideal. Therefore, the stream-making process of the procedure was completed.
Once the stream-maker was constructed, we needed a setup that would take the data we needed to determine the amount of volume displaced by splashing. This setup consisted of a tuna-fish can, a window screen, tag board, water, a Bunsen-burner stand, and a water level equalizer. The tuna-fish can was filled to the brim with water, and then placed beneath the stream, creating the necessary splashes. The can was placed on top of the window screen, which was positioned over a sink. The screen acted not only as a support for the tuna can, but also as a drain for water overflow created by the stream maker, and a support for the tag board, which was used as the measuring device. The tag board was cut into rings, two centimeters in width, with varying diameters. The rings were positioned so that a two-centimeter gap was present between the can and the first ring, and the rest of the rings lay adjacent to each other.
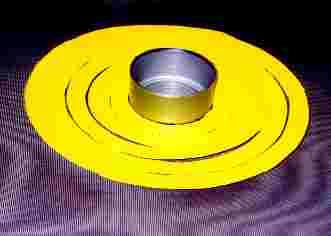
Ring Set-up
The Bunsen-burner stand was used to suspend the stream-maker at a constant height of 51.7 centimeters above the can, plus or minus 0.5. This made our height variable controlled as well. Held above the stream-maker and Bunsen-burner stand was the water level equalizer, which was identical to the stream-maker. The purpose of the equalizer was to release water into the stream-maker at the same rate water was escaping, therefore keeping a constant volume in the stream-maker, and a constant force of weight acting to create stream flow. This kept our stream intensity at a constant, controlled quantity. Using the equalizer, we kept the water level 2.5 centimeter below the brim of the container. A strapping young scientist manually suspended the stream equalizer. While the stream ran for 20 seconds, the tag board was collecting the splash droplets ejected from the tuna can. After the 20 seconds passed, the stream was stopped by placing a finger over the opening while holding out a towel to capture and extra drips. Before the experiment ran, each individual ring was weighed in grams by the electronic scale. Afterwards, the rings were carefully removed from the screen, and weighed again, this time with the essential water droplets.
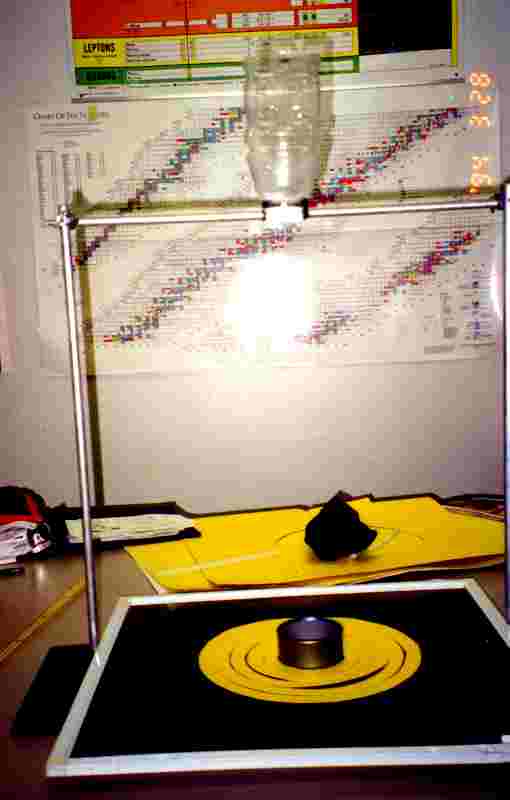
Complete Experiment set-up
In order to determine the volume of water displaced, we subtracted the initial mass from the final mass. Knowing that the mass of one milliliter of water is exactly one gram, we were able to determine the volume of water displaced onto each ring.
|
Trial 1 |
|
|
|
|
|
|
|
Initial Mass (g) |
Final Mass (g) |
Volume of Water (mL) |
|
|
Ring 1 |
5.49 |
5.73 |
0.24 |
|
|
Ring 2 |
4.57 |
4.84 |
0.27 |
|
|
Ring 3 |
3.62 |
4.03 |
0.41 |
|
|
Ring 4 |
3.22 |
3.91 |
0.69 |
|
|
|
|
|
|
|
Trial 2 |
|
|
|
|
|
|
|
Initial Mass (g) |
Final Mass (g) |
Volume of Water (mL) |
|
|
Ring 1 |
5.63 |
5.78 |
0.15 |
|
|
Ring 2 |
4.7 |
4.99 |
0.29 |
|
|
Ring 3 |
3.9 |
4.18 |
0.28 |
|
|
Ring 4 |
3.38 |
4.04 |
0.66 |
|
|
|
|
|
|
|
Trial 3 |
|
|
|
|
|
|
|
Initial Mass (g) |
Final Mass (g) |
Volume of Water (mL) |
|
|
Ring 1 |
5.75 |
6.11 |
0.36 |
|
|
Ring 2 |
4.95 |
5.32 |
0.37 |
|
|
Ring 3 |
4.05 |
4.39 |
0.34 |
|
|
Ring 4 |
3.84 |
4.68 |
0.84 |
|
|
|
|
|
|
|
Averages |
|
|
|
|
|
|
|
Initial Mass (g) |
Final Mass (g) |
Volume of Water (mL) |
|
|
Ring 1 |
5.623333333 |
5.873333333 |
0.25 |
|
|
Ring 2 |
4.74 |
5.05 |
0.31 |
|
|
Ring 3 |
3.856666667 |
4.2 |
0.343333333 |
|
|
Ring 4 |
3.48 |
4.21 |
0.73 |
This chart displays our RAW data. The “Initial Mass” was the mass of each ring before each trial, while “Final Mass” was the mass after the trial. The “Volume of Water” represents the difference between the two masses, and because one gram of water equals one milliliter, the volume. Also, we averaged the data for each ring, which we will use in our analysis.
Clearly the data reveals that the close rings collected more water splashes, or at least greater volumes of water splashed.
As shown by the graph, the
negative slope of the line reveals that the rings further away from the can
collected less water. Thus, our
hypothesis is confirmed.
Another way to look at the data is to examine the amount of water per the unit of area that was displaced at the varying radii. To find the areas of the rings, we found the area using the largest radius of each ring and subtracted the area found using the smaller radius. Therefore, the formula we used was:
p r - p r
Using the above formula, we came up with the following data table.
|
|
|
|
|
Areas |
|
|
|
|
|
|
|
|
|
|
|
Ring 1 |
|
|
|
|
|
|
|
|
Diameter (m) |
Radius (m) |
Area Outside (sq. m) |
Area Inside (sq. m) |
Total Area (sq. m) |
mL per sq. m |
|
|
0.284 |
0.142 |
0.063347074 |
0.046759465 |
0.016587609 |
15.07149082 |
|
|
|
|
|
|
|
|
|
Ring 2 |
|
|
|
|
|
|
|
|
Diameter (m) |
Radius (m) |
Area Outside (sq. m) |
Area Inside (sq. m) |
Total Area (sq. m) |
mL per sq. m |
|
|
0.244 |
0.122 |
0.046759465 |
0.03268513 |
0.014074335 |
22.0259073 |
|
|
|
|
|
|
|
|
|
Ring 3 |
|
|
|
|
|
|
|
|
Diameter (m) |
Radius (m) |
Area Outside (sq. m) |
Area Inside (sq. m) |
Total Area (sq. m) |
mL per sq. m |
|
|
0.204 |
0.102 |
0.03268513 |
0.021124069 |
0.011561061 |
29.69738974 |
|
|
|
|
|
|
|
|
|
Ring 4 |
|
|
|
|
|
|
|
|
Diameter (m) |
Radius (m) |
Area Outside (sq. m) |
Area Inside (sq. m) |
Total Area (sq. m) |
mL per sq. m |
|
|
0.164 |
0.082 |
0.021124069 |
0.012076282 |
0.009047787 |
80.68271421 |
|
|
|
|
|
|
|
|
|
Ring 5 |
|
|
|
|
|
|
|
|
Diameter (m) |
Radius (m) |
Area Outside (sq. m) |
Area Inside (sq. m) |
Total Area (sq. m) |
|
|
|
0.124 |
0.062 |
0.012076282 |
|
|
|
Because the areas are smaller the closer to the can and larger further away, analyzing the data in this manner gives a more objective view of the patterns of water displacement. If we only examine the displacement in comparison to the radius, we are neglecting the fact that more volume has been splashed into a smaller area. By looking at the data as a ratio, we can see that comparing radius to volume/area reveals even greater differences between the rings.
This graph shows that breaking the data up by area does not affect the result that the smaller ring collects more water. In fact, it magnifies the results, because even though Ring 4 is the smallest in radius and area, it still collects the most splashes.
By setting up an apparatus
designed to test the splash patterns of streams of water, we have determined
that greater volumes of splashes fall closer to the source than further
away. However, the graphs did not
display data with a constant slope or an exponential curve, so it seems that no
distinguishable pattern is observable using our present procedure.
No good experiment is complete without taking into consideration the uncertainties brought about by human and machine imprecision. The uncertainties in our masses were give or take .02 grams, making our averages’ uncertainties effect the volume calculations. The areas, while measure very carefully, may have been off by as far as .001 meters. While these variations in data may have affected the graphs somewhat, they would not have affected the overall conclusion that more splashes land closer to the source.
In conclusion, although our hypothesis was proved to be correct, further examinations could explore the effect of changing the height of the apparatus above the can, or even examining the various radii of the drops. However, the hypothesis proved accurate, and now we know where to clean the floor in the bathroom.
SciCentral - Best Fluid Physics Online Resources. View other studies in fluid dynamics.
Physics News - The latest in research in the field
Cornell University Fluid Dynamics - Research Laboratories from Cornell University
The University of Melbourne- Department of Mechanical and Manufacturing Engineering
UC Irvine Fluid Dynamics-Theoretical and Computational Researchers
International Journal of Fluid Dynamics- Outstanding Web Journal on the Dynamics of Fluid
Computational Journal on Fluid Dynamics- Includes several other exciting Fluid Dynamics