Pursuing the Chaotic Dynamics
of Nucleate Boiling .:. Go Up
Chris Murray
Tualatin High School
Jack Semura
Portland State
University
Table of contents:
Introduction
Method
Results and Discussion
Acknowledgements
Links
Abstract
At high rates of
flow, dripping faucets display chaotic behavior. We investigated whether
the bubbles leaving a nucleation site in boiling water exhibited the same
kind of chaos. We gathered time series data for bubbles leaving a single
nucleation site using a laser and photo-diode, and searched for strange
attractors. Although we never saw a true attractor, some data suggested
pre-chaotic behavior.
Introduction
Table
of Contents
When a leaky faucet drips at low rates, the dripping is periodic. The
drips are separated by the same amount of time: (drip... drip... drip...
drip...) This is because there is a certain rate at which water is being
supplied to form drops, and a certain size of drop which can be suspended
by the adhesion and cohesion of the water before it drips. The period is
determined by the drop size divided by the flow rate. This is a linear
relationship. It gets a little tricky because the drop size does interact
with the flow rate a little, ( R. F. Cahalan, H. Leidecker, and G. D. Cahalan,
"Chaotic rhythyms of a dripping faucet," Comput. Phys. 4, 368-383 (1990))
but the important thing here is that the drip rate is constant at low flow
rates. A time series of a constant drip
rate might look like figure 1.

Figure 1 - Time series for constant
period
Table
of Contents
The period is all the same,
so you get a straight line. When you turn the flow rate up a bit,
the picture gets a bit more complicated. Instead of a constant
period, you get two different periods. (It sounds like da..dup....da..dup....da..dup....da..dup....da..dup....da..dup)
This is called period doubling. It looks like
Figure 2 - Time series exhibiting
period doubling
Table
of Contents
This is evidence
of period doubling, one of the routes to chaos. The higher rates of flow
you get four bands across the time series or "period four" and then eight,
and sixteen with the doublings occurring at an increasing rate. This is
because the drop that is dripping does not get out of the way of
the next forming drop in time and they begin to interact.
The
interaction is at first linear and occurs when the dripping drops
cause the forming drop to oscillate.(Anyone who has spent any time watching
a Lava Lamp has seen this in slow motion!) If the drip rate is fast
enough, you enter a chaotic regime in which the drops seem to fall at random
intervals (da da..dupdup dadup da dup da duppdup di di dup) A time series
graph of this might look like:

Figure 3 - Chaotic time series
Table
of Contents
(It doesn't. I created this
data with a computer program.) But these are not really random, the time
series just makes them look that way. If you plot them with the nth
drop as the x axis, and the n+1th drop as the y axis,
you ( R. Shaw, The Dripping Faucet as a Model Chaotic System (Aerial, Santa
Cruz, CA, 1984)) get a pretty picture. Figure 4
has
a graph of the data from figure 3 plotted this way

Figure 4 - A chaotic strange
attractor.
Table
of Contents
This is a strange attractor, (This
is not dripping faucet data - it is the attractor
of Henon) and this type of graph is called a Phase space plot.
The points from figure 3 fall unpredictably on the
pattern shown in figure 4, drawing a picture that is infinitely
complex ( If you zoom in on any one line, it is made up of perhaps two
lines, three and then two, and each of those lines are made up of two lines,
three lines and then two and so on to the limit of precision.) and clearly
not random.
My research question was whether
the bubbles leaving a nucleation site (When you leave a pan of water on
the stove boiling at a low level, nucleation sites are those spots that
have little streams of bubbles leaving them. You also see them sometimes
on the side of a glass of soda pop.) in boiling water were chaotic in the
same way that drops leaving a leaky faucet were. My holy grail was a strange
attractor; I would know that the time series data for bubbles was chaotic
if I got a strange attractor when plotted in phase space.
Method
Table
of Contents
I decided upon a "double boiler"
kind of arrangement, with an outer bath heated by coils of nichrome wire,
and a vibrationally isolated inner bath where the experiment would take
place. Into this inner bath I would put various heated objects likely to
have nucleation sites. I would shine a laser through the whole thing, and
the rising bubbles would interrupt the beam, allowing me to time their
departure from the nucleation site using Transpacific's
Universal Laboratory Interface (ULI). Figure 5 shows
a cross section of the apparatus taken in the plane perpendicular to the
laser beam.
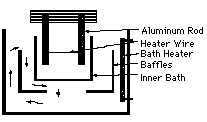
Figure 5 - Cross section of
experimental setup. The arrows show the
direction of the circulating
heated water.
The inner dimensions of the outer
bath were 16" wide, 14" tall, and 6" deep, and the
walls were of 1/2" polycarbonate
plastic to withstand high temperatures. The outer bath was
an ethylene glycol solution, and the inner bath was distilled water. The
entire apparatus rested on a two-tiered isolation table of the poor man's
type: a 1 1/2" x 24" x 32" slab of concrete on top of four wheelbarrow
inner tubes on top of another slab of concrete on top of four more inner
tubes. The vibrational isolation was important because chaotic
systems are extremely sensitive.
Results
and Discussion Table of Contents
Looking at the nucleation sites on a tightly stretched heater wire turned
out to be a bust. The multiple sites on a wire would tend to communicate
with each other and take turns nucleating. The rate of a particular site
would oscillate up
and down.

Figure 6 - Times series of a
fluctuating nucleation site.
This is not what I wanted. I needed
to look at one nucleation site operating independently to get the kind
of attractor that the dripping faucet displayed. As I thought about this,
I noticed a stainless steel screw that held the inner bath to its support
nucleating with a constant period. It was a Phillips head screw with the
head end in the inner bath, and the thread end immersed
in the outer bath. I realized right away what was going on. The thread
end was being heated, and as the heat conducted along the screw itself,
in equilibrium, the deepest part of the cross-shaped indentation was the
hottest. I quickly rigged up a heated screw to put in my apparatus where
the laser could reach it. When I heated it up, nothing really happened
with the screw, but one of the wires holding the screw began to nucleate
like mad. In desperation I aimed the laser at this
stream of bubbles and aligned the photo diode. It
turned out to be the best data I would ever get. My time series data looked
like:

Figure 7 - Potentially chaotic
time series derived from a series of bubbles
leaving a holder wire on my
setup.
Table
of Contents
This was sufficiently chaotic
looking for me, so I plotted it as a phase graph and I got:

Figure 8 - Alleged strange attractor
derived from the data in figure 7
Data Files: file1 file2
file3 - These are text files with decimal times
in microseconds. The times are already set up in two columns n, n+1
and the columns are tab separated, Rows are separated by a
new line.
Clearly, I was not seeing a random
distribution of points. There were prominent areas of nothing as opposed
to random distribution covering the plot frame more or less evenly. It
also wasn't clearly a strange attractor, it might have been a blurred graph
of periodic bubbling. Since multiple period dripping is a precursor to
chaos, I was encouraged by these results. Already running late for the
day, I shut down my experiment, and biked home, hoping to resume study
of this nucleation site the next day.
The site never bubbled again for
me. I tried a number of things after that, but never got a nucleation site
as well behaved as my holder wire. With Summer 1997 drawing quickly to
a close, I felt a bit desperate, so I tried blowing
water vapor through a small hole in the end of a plastic tube. It wasn't
a nucleation site, but it might show some signs of chaos, or pre-chaos.
This would at least support the notion that a nucleation site would be
chaotic, and it would give me a bit more to talk about in Tucson.
Although I never
got a strange attractor, I did get some data that resembled period doubling
behavior. One of the most promising time series looked like

Figure 9 - Time series from
water vapor bubbles leaving a tube immersed in near-boiling water.
The four horizontal lines are
evidence of period four behavior.
Data Files: File1
File2 File3 File4
Which is clearly
period four with a lot of noise.
I intend to pursue
possible chaos in streams of bubbles perhaps just using compressed air,
and not nucleation. My apparatus for this experiment turned out to be just
barely functional. In order to get the inner bath hot enough for boiling,
the outer bath, even with its ethylene glycol, was always on the verge
of boiling and would periodically bump, shaking the entire experiment.
Using compressed air would eliminate this problem.
Acknowledgments
Table
of Contents
I would like to
thank Jack Semura, Erik Bodegom, and Jean Murray of PSU for their technical
help, Ed Saunders of TAP Plastic for making the apparatus itself, my wife
Shannon for listening to me about bubbles, and my son Keenan for tolerating
my absence. None of this would of course be possible without the generous
funding from the Murdock Charitable Trust and the Research Corporation.
Links
Table
of Contents
-
Chaos
at Maryland- The Best page I found. Has a page of links to other
sites related to nonlinear mechanics
-
Chaos
Theory - A Brief Introduction - Primer on chaos theory. A good
place for additional information.
-
Burning
Chaos Page - Cool animations and JAVA Applets for generating chaotic
images.
-
Dynamics,
Chaos and Molecular Modeling - Modeing of various chaotic functions
in real time as you watch and scroll
-
Fractal
Gallery - Color pictures of fractal images.
-
The
Fractal Microscope - Download software to interactively zoom into and
out of the mandelbrot set.
-
Test
Fractal Generator - Script that generates fractals.