The Effect of Drop Height on Bounce Time: Introduction | Method | Results/Analysis | Conclusion | Links | Bibliography | Return to research
Braden Magdelain
Tualatin High School
.:. Top Introduction:
Bouncing balls have been a fascination of mine for as long as I can remember. Playing a multitude of sports I was exposed to many variations of bouncing balls, but the scientific explanation remained a mystery to me. After many years, this course has finally granted me the opportunity to explain the relationships between different factors of velocity and bounce height. Being passionate about a variety of sports, this struck home as I thought about the extensive amount of sports equipment I had used and the ways the speed of each ball affected the height of their bounce. Each time a ball would bounce, the speed and frequency varied depending on the height it was dropped from. A large factor leading to my curiosity in my childhood was that of a ping pong table, the biggest Christmas present I received when I was only eight. The table resulted in many competitive matches with my sister but she slowly wanted to play less and less. As I grew older I began to ask questions about the drop of height between bounces. Slowly my sister grew tired of our matches, and I started to wonder if I was to play versus myself, how long would I be able to play? What factors would impact longevity? Was it the ball, my table, or something else entirely? I had yet to ponder a relationship between drop height and bounce time.
I was aware of a simple concept, dropping a ball would result in shorter consecutive bounce heights due to the force of gravity. Multiple relationships can be discovered through SUVAT: “S” being displacement, “U” being initial velocity, “V” being final velocity, “A” being acceleration, and “T” being time. The relationships between these are visualized in formulas, as
v² = u² + 2(a)(s) v = u + (a)(t) s = (u)(t) + ½(a)(t²) s = (v +u)(t) / 2.
Each of these formulas are used to solve for one of the missing values, and can be derived into each other. Based on this, I believe the relationship between acceleration, velocity, and time is constant and therefore I believe my data results will show a square root relationship.
The purpose of this investigation is to determine a relationship, if any, of the drop height of the ball and the time between bounces. I will explore this by varying drop height and measuring the time between the first and fifth bounces.
Hypothesis: I believe my mathematical results will show a square root curve between drop height and bounce time through SUVAT. Using v² = u² + 2(a)(s) where “a” is the force of gravity (g), and “s” is drop height (h). This can be derived into V = √2gh. Each shows the relationship that time or height has with the speed and the impact this will have on the repeating bounces of the ping pong ball. V = u + (a)(t) illustrates that with a greater final velocity there is a greater time. With v = √2gh, it is evident that the increase of “h” will also increase “v”. With increased “v”, “t” should also increase meaning with a greater height there should be more time between bounces.
Variables:
My independent variable of this experiment was drop height. I manipulated this
at 5cm intervals while collecting data. My dependent variable will be the time
between bounces of the ping pong ball, as I will measure this after altering
the drop height. Some control variables include the ping pong ball used for all
data collection, the meter stick, and the table surface. This was a priority as
a different ping pong ball could bounce differently than the original and the
surface could be at a slightly different angle if performed elsewhere. Possibly
could include the same LabQuest program and microphone.
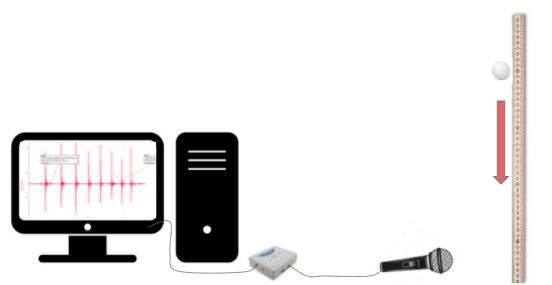
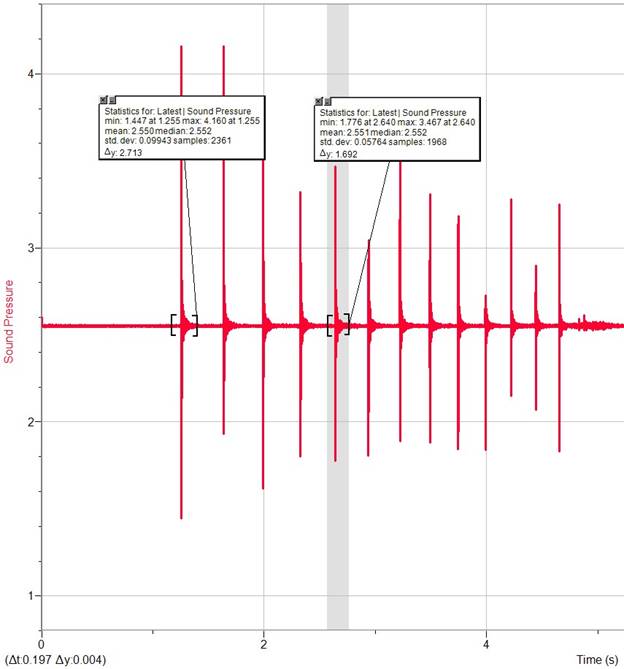
A meter stick was used to measure the drop height, and a ping pong ball was the ball used to indicate bounce time. A microphone to detect bounce sounds was connected to a LabQuest Mini program, which translated the bounce sounds into a sound pressure vs time graph. The LabQuest Mini was plugged into a Mac computer which showed the graphs in live time. A flat surface, in this case a table, was required to perform this experiment.
.:. Top Method
In an attempt to gather the most accurate and sufficient data, I collected 45 samples with 3 samples across 15 different heights. To reduce uncertainty or inaccurate results I used the same materials across the entire experiment, most importantly the same ping pong ball and meter stick. I started data collection by first plugging the stick microphone into the LabQuest Mini, and plugging the LabQuest into the Mac. Monitoring for mishaps, I tested the responsiveness of the mic making sounds and checking the readings on the computer. The readings were consistent, so I began dropping the ping pong ball at 75cm high on the meter stick and about 10cm away from the microphone. Letting the ball bounce 6-10 times, I found the time elapsed at the first bounce and the time elapsed at the fifth bounce. I collected three different times for each interval of 5cm from 75cm down to zero. I decided on three trials of fifteen variations because the time in seconds was being recorded so exactly that there wouldn’t be excessive uncertainty. Believing there was a square root relationship, I thought fifteen variations was better than ten because ten would only use half of the meter stick. If the relationship was not consistent, perhaps I would discover different results at ¾ of a meter stick instead of simply stopping at half. My original target was three trials and ten variations as my data was on the difficult side to collect, but with more data comes higher quality results.
Data Table:
|
Height (cm) ± 0.10 cm |
Time (s) ± 0.00 s |
|
0.00 |
0.000 |
|
5.00 |
0.747 |
|
10.00 |
1.008 |
|
15.00 |
1.233 |
|
20.00 |
1.379 |
|
25.00 |
1.517 |
|
30.00 |
1.677 |
|
35.00 |
1.771 |
|
40.00 |
1.956 |
|
45.00 |
1.945 |
|
50.00 |
2.011 |
|
55.00 |
2.097 |
|
60.00 |
2.169 |
|
65.00 |
2.230 |
|
70.00 |
2.288 |
|
75.00 |
2.376 |
.:. Top Data Processing
I produced data points first by finding the difference of time at the max sound pressure of the fifth and first bounces, then adding them all for each separate drop height. Dividing the resulting number by three, I found the average time between bounces at each drop height multiple of five from 0 - 75cm. With these times, I put them in a table across from the height they were dropped at and plotted the points on a scatter graph. After the points were plotted, I neglected the point (0,0) as the trend line was being affected by this point and (0,0) is uninfluenced by slope. The residuals from the trend line were shorter than the previous trend line which more accurately represented the root relationship being investigated.
The data seems to follow a root slope, but there is a slightly weaker correlation (R-value) than I predicted. R = 1 would have been perfect, but .9+ was sufficient enough to call a decent correlation. This is likely due to uncertainty in drop height of about ±0.1 cm. There was no uncertainty of time as the program was run with a mic and LabQuest, the sound was receptive the second the ball hit the table. The points from 25-40cm appear to have the largest residuals, and this is likely due to human error on the exact drop height as I simply eyeballed the height on the meter stick. Though I didn’t proceed with haste and I attempted to make it as exact as possible, there is still a fraction of uncertainty roughly 0.1cm. I believe with zero height uncertainty the points would be a better square root slope with a correlation coefficient very close to one.
.:. Top Conclusion
It is clear that the relationship between drop height and bounce time is a square root relationship (common within physics) and the slope discovered is universal to these conditions. The sample size is large and sufficient, and performing the same experiment with any variation of height would yield a similar relationship in regards to the slope. Though my hypothesis was not perfectly supported, I believe this is due to my error and not the relationship between drop height and bounce time as u + (g)(t) = √2gh (v = v). “g” is the gravitational acceleration constant of -9.81 m/s², and being on either side of the equation it can be disregarded. “u” is the initial velocity, as stated before, and since the ball is being held then dropped the initial velocity is zero. Disregarding “u” and “g” it is clear there is a direct relationship between “t” time and “s/h” height/displacement. Another possible error is the uncertainty of angle of the drop. The meter stick was not secured to the table, I held it steady with my hand so the drop of the ping pong ball may not have been perpendicular to the table. The angle of the meter stick and the table would be slightly below 90 degrees and therefore the ball would be dropped a fraction of an inch lower than the expected height. The uncertainty remained small because the base of the meter stick was square, and made it easy to hold perpendicular to the table reducing error in drop height. Easy ways to address these uncertainties and errors would be to secure the meter stick down to the table at 90 degrees. This could likely be done simply with tape, I was unable to do this because the table was frequently used by other students and I would not be able to leave a standing meter stick. The way to fix errors would be to rest the pin pong ball on a handheld flat surface, easier to measure to the exact inch. Then, instead of dropping the ball by hand, the surface could drop out from beneath the ball and produce a natural falling trajectory at 90 degrees.
The next question I desire to answer is the relationship between drop height/bonce time and ball velocity. Can I use drop height and bounce time to construct a model that can determine the ball’s velocity at certain points in the fall? I believe that is the next logical progression I would take after this experiment because I could eventually determine how much force I needed to keep the ball volleying back and forth at a playable height.
.:. Top Links
Related Sites
Home: I found this interesting because it was a similar study but they examined a wide variety of different sports balls.
What Is the Relationship between Bounce Height and Drop Height?: This is another similar study but more focused on the heights rather than time and sound.
Mathematics: A deeper dive into the mathematics and calculations behind drop height experiments with quadratic and exponential models.
The Bouncing Ball: A walkthrough to perform a similar experiment yourself. Explains calculations and provides questions to further understanding.
Experiment of the Month: A Millersville University student’s experiment exploring behavior of a bouncing ball was voted Experiment of the Month. An educational overview of the experiment is provided.
Bowling Ball in a Vacuum: Not entirely related to the experiment, but the dropping of a bowling ball in a large vacuum compared to feathers. Interesting nonetheless.
“Home.” Science Projects, 1999,
https://www.scienceprojects.org/what-factors-affect-the-bounce-of-a-dropped-ball/.
Wilson,
Michael. “What Is the Relationship between Bounce Height and Drop Height?” Restaurantnorman.com, 14 Sept. 2020,
https://www.restaurantnorman.com/what-is-the-relationship-between-bounce-height-and-drop-height/.
Horton,
Bob. “." Mathematics. . Encyclopedia.com. 25 Apr.
2022 .” Encyclopedia.com, Encyclopedia.com, 10 May 2022,
https://www.encyclopedia.com/education/news-wires-white-papers-and-books/bouncing-ball-measurement#:~:text=Using%20a%20formula%20from%20physics,to%20fall%20from%20each%20height.
“Lesson 5:
The Bouncing Ball - Cengage.” Lesson 5: The Bouncing
Ball,
https://college.cengage.com/reviewers_authors/mathpremiere/beginning_algebra/maricopa/try_it/linear_behavior.pdf.
“Experiment of the Month.” Millersville University, 3 June 1970, https://www.millersville.edu/physics/experiments/045/.