Exploring the correlation between the drop height and rebound coefficient of a tennis ball
Sean Khanna
Background | Method | Results | Conclusion | Links | Bibliography | Return to research
The earliest records of the game of tennis date back to a “12th–13th-century French handball game called jeu de paume (‘game of the palm’)” (Bruce, Lorge). It was first used as a form of entertainment during ceremonial occasions, played with one’s hands. Then, the ball was hit with leather gloves, which were eventually replaced with racquets. Following the evolution of the racquet, the tennis ball underwent numerous changes as well. Originally, the balls were stuffed with wool or cork and wrapped around with a cloth. These balls did not bounce very much and were later “filled with cellulose material” to increase their rebound (History of Tennis). Now, tennis is a sport played between two opponents (consisting of one or two players) to hit a ball over the net onto their opponent’s court. A player is awarded a point if their opponent fails to return the ball into the select portion of their court.
Modern tennis balls must fit certain criteria in order to be eligible for regulation play. The International Tennis Federation (ITF) places restrictions on the diameter (6.54-6.86 cm), mass (56.0-59.4 g), and various other characteristics. The balls are hollow as they are filled with air, which is surrounded by a rubber compound. This compound is covered by an outer felt layer of fluorescent yellow-colored (for visibility) felt to reduce aerodynamic lag and equip the ball with improved airborne capabilities. Tennis balls are stored in pressurized cans to retain a constant internal ball pressure, and the balls begin to lose pressure as soon as the can is opened. Rebound tests are conducted in the inspection of tennis balls, where balls are dropped “vertically from the height of 100'' and the rebound height is measured, which should fall between “53 - 58in.” (AQF Team).
There are countless variables that play a large role in determining the speed and trajectory at which the ball travels, such as the angle, strength, and motion the ball was hit. Since there are so many variables involved in the trajectory of a tennis ball, I limited my research to a singular one. This is the effect that the starting height of the ball has on its rebound height. As I have been playing tennis competitively for many years now, I was curious to see the correlation (if there exists any) between these two factors, and if so, how prominent it was. In tennis, it’s advised to consistently hit the ball 6 feet above the net in order to maintain long rallies. In high-pressure situations, I often lob the ball higher to increase the probability of hitting the ball on the court and make it difficult for my opponent to hit a great return off of a high rebounding ball. Understanding the difference that a slight increase in height of the ball’s trajectory after a rebound can influence my game, as it plays a role in determining what kind of way to hit the ball.
When balls are dropped from a height the gravitational force pulls them to the ground. The trapped kinetic energy of the ball turns into elastic deformation when contacting the ground, and the ball restores its original shape as it pushes off of the ground. When the tennis ball strikes a solid object, the shockwave of energy that travels through the ball can affect the initial rebound velocity. I believe that there will be a diminishing return on the rebound height of the ball with the heightened drop point, due to the limited kinetic energy the ball can store.
Statement of the problem:
The purpose of this investigation, therefore, is to find the relationship, if any, between the drop height and the rebound coefficient of a tennis ball. More specifically, the drop height is the distance from the point of dropping to the ground, and the rebound coefficient is the ratio of rebound height to drop height. Variables such as the mass, diameter, air pressure, and initial velocity of the ball, as well as the rebound surface, are all controlled in this experiment.
Hypothesis:
I believe that (with height as the independent variable and percent rebound as the dependent variable) there will exist a relationship between an increase in drop height and an increase in percent rebound. The velocity of the ball will likely increase with higher starting heights, which will increase the rebound height as well. More specifically, I infer that the rebound coefficient of the ball will decrease as the drop height increases; there are likely factors that will cause the ball to lose efficiency in its rebound
Materials:
● A tennis ball can (3 balls)
● Slow-motion camera (phone)
● Meter sticks (2)
● Tape
● Control surface (concrete)
Diagram of the setup:
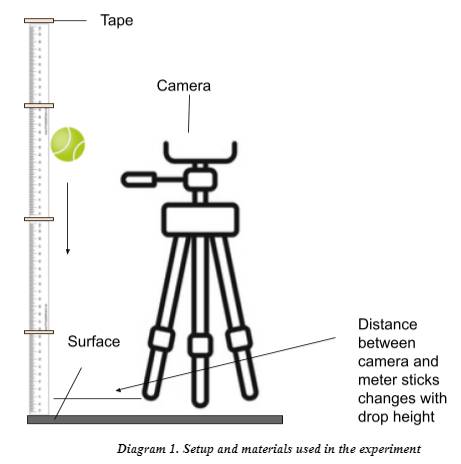

In the initial setup, 2-meter sticks were taped together onto the wall of my garage. A camera on a stable mechanism was set up directly across from the starting point of the ball to capture its rebound height.
Procedure:
The ball was dropped from 10 different heights, ranging from 20-200 cm in 20 cm increments. When first dropping the ball from the 20 cm height, the tripod was lowered to be horizontal from the ball and capture its rebound in slow motion. After starting to record the video on the phone (held by the tripod), the ball was dropped from my hand at the 20 cm mark. After the ball’s initial rebound was recorded, the video was stopped and replayed. I went through the video frame by frame to record the highest rebound height the ball reached by estimating the highest point of the ball with its corresponding height behind it (on the meter stick). After recording the rebound height, this process was conducted 2 more times, each with different new balls from the can. This process of collecting 3 trials of data from each height was repeated for the rest of the 9 drop heights.
A total of 10 variations (drop heights) of 3 trials were conducted in this experiment. As there are a multitude of different shots in tennis (drop shot, overhead, groundstroke, etc.), I was interested to see any patterns with the rebound coefficient with varying drop heights. 3 tennis balls were used throughout this experiment to mitigate unreliability in data collection. This is because soon after opening a new can, tennis balls begin to lose pressure, especially after their initial bounces. Each of the 3 balls was used correspondingly with each of the 3 trials and was one of the controlled variables. A data range of 10 drop heights was used to help visualize patterns or changes in the data.
Whereas the balls, number of trials, and testing environment (concrete floor of my garage) were kept controlled, the varying drop heights were the independent variables in the lab. With each change in these, I was aiming to find a correlation between the dependent variable, the rebound coefficients of the tennis balls as well.
Raw Data:
The initially collected data is shown below.
|
Height (cm) |
Trial 1 |
Trial 2 |
Trial 3 |
Trial Average |
|
20 |
19 |
19.1 |
18 |
18.7 |
|
40 |
29 |
28.8 |
31 |
29.6 |
|
60 |
40 |
39 |
42 |
40.3 |
|
80 |
51 |
49 |
52 |
50.7 |
|
100 |
62 |
60 |
65 |
62.3 |
|
120 |
74 |
76 |
75 |
75 |
|
140 |
85 |
78 |
86 |
83 |
|
160 |
91 |
83 |
97 |
90.3 |
|
180 |
99 |
94 |
103 |
98.7 |
|
200 |
111 |
102 |
111 |
108 |
Table 1: Initial Rebound and average rebound heights at drop heights (in increments of 20 cm)
This data was then converted into coefficients, and the uncertainties were calculated below as well. Each trial value and average were divided by its respective height to convert it into a rebound coefficient.
|
Drop height |
Rebound coefficient |
||||
|
(± 1 cm) |
% in cm |
cm |
cm |
||
|
x / cm |
Trial 1 |
Trial 2 |
Trial 3 |
Average |
Uncertainty |
|
20 |
0.95 |
0.955 |
0.9 |
0.935 |
0.028 |
|
40 |
0.725 |
0.72 |
0.775 |
0.74 |
0.028 |
|
60 |
0.667 |
0.65 |
0.7 |
0.672 |
0.017 |
|
80 |
0.638 |
0.613 |
0.65 |
0.633 |
0.019 |
|
100 |
0.62 |
0.6 |
0.65 |
0.623 |
0.025 |
|
120 |
0.617 |
0.633 |
0.625 |
0.625 |
0.008 |
|
140 |
0.607 |
0.557 |
0.614 |
0.593 |
0.029 |
|
160 |
0.569 |
0.519 |
0.606 |
0.565 |
0.019 |
|
180 |
0.55 |
0.522 |
0.572 |
0.548 |
0.025 |
|
200 |
0.555 |
0.51 |
0.555 |
0.54 |
0.023 |
Table 2: Initial rebound heights, averages, and uncertainties at drop heights
The following graph is from the table above.
Graph 1. Drop height vs. mean rebound coefficient
In sketching the minimum and maximum slope lines, the first two points were disregarded as outliers.
Min slope: Upper left endpoint: (0.00, 0.62) Lower right endpoint: (200, 0.58)
Min
slope: = ![]() = -0.0004 %/cm
= -0.0004 %/cm
Max slope: Upper left endpoint (0.00, 0.83) Lower right endpoint (200, 0.47)
Max
slope: = ![]() = -0.0018 %/cm
= -0.0018 %/cm
Slope Uncertainty:
Uncertainty
of slope: = ![]() = -0.0014
= -0.0014
Final slope:
Slope = -0.00168 = -1.682 x 10⁻³ +/- -0.0014 %/cm
Though the linear regression was a good fit for the data per an R2 value of 0.752, I decided to better model the data through the power function y = Axn. In order to do so, I first created a log-log graph to find the necessary values.
Graph 2. Log drop height vs. log rebound coefficients
If y = Axn, then log(y) = nlog(x) + log(A)
The log-log line’s y-intercept is equal to Log(A), and its slope is the exponent n.
Log(A) = 0.237
A = 100.237 ≈ 1.74
From
here, I deduced the value of the coefficient A (1.74) and the power n (-0.22)
for the power function to make the linearized graph![]() vs x
below.
vs x
below.
Graph 3. Power function of drop height vs. rebound coefficient
The log-log function most accurately represents the change in data, as it has the highest R2 value of 0.971, meaning that the line of regression closely fits the data points.
Evaluation:
As both the initial and log-log graphs show, there is a strong correlation between an increase in drop height and a decrease in the rebound coefficient, which supports my hypothesis. The expected hypothesis that an increase in drop height causes an increased rebound height was proven in Table 1. Per Table 1, a 100 cm drop height resulted in an average rebound height of 62.3 cm, whereas a higher 200 cm drop height caused a higher average rebound height of 108 cm. This is likely due to the ball’s increased kinetic energy, given by the formula:
![]()
The velocity (v) can also be expressed as
![]()
Where s is the displacement, or in this case, the drop height. An increased drop height (s) results in a higher velocity (v), which leads to an increase in the ball’s kinetic energy (k), ultimately causing the ball to bounce higher.
Furthermore, my hypothesis that an increasing drop height will yield a decreasing rebound coefficient was also proven as well. Per Graph 1, the data points fit a negative linear trend, displaying a negative relationship between the two variables. A reason for this may be the elastic tennis ball storing an increasing amount of energy, as a ball can only store a limited amount of potential energy. Another element may be the air friction the ball encounters, especially at higher drop heights. The longer a ball falls, the more kinetic energy it will lose due to the air friction. The continuous loss of energy from these factors must be disproportionate to the energy gained from the increased speed of the ball with higher drop heights in order to cause a negative slope between the two variables.
This trend implies that shorter drop heights are more efficient, as the ball doesn’t waste as much energy, and more kinetic energy is converted into elastic potential energy. Also, with a shorter drop height, the ball travels a lesser distance, thus encountering less air friction which can reduce its velocity before impacting the ground.
Limitations:
Though the results in the experiment support the hypothesis, there were numerous limitations throughout the study, which may have influenced the quality of data. Firstly, the ball was dropped carefully by hand, which introduces some uncertainty to the drop height. Though I tried my best, it’s almost impossible to accurately drop the ball from the precise height, also without a degree of any spin as well. Also, since the rebound heights were recorded after analyzing a video of the rebound, this was a major weakness in the collection of data. The maximum rebound height of the ball was eye-balled from the slow-motion footage and may have been off by 1-2 cm depending on the manual release of the ball or the angle of the camera. Also, the few trials may have resulted in inconsistent data, especially due to the nature of the bounce of a tennis ball. For instance, the images below, from ScienceLuxembourg’s YouTube video, showcase the slow-motion bounce of a tennis ball. An example of this is apparent in Graph 2, where the negative slope of points comes to a brief stall when y=-0.2, where the log drop heights remain mostly unchanged at ≈2.0 cm and ≈2.15 cm.


Images 1 (left) and 2 (right), initial impact and rebound of a tennis ball in slow motion
As can be seen in the images above, the tennis ball undergoes rapid oscillations upon striking the ground (Image 1) which affects the ball's departure from the surface and rebounding (Image 2). Depending on what point during the deformation of the ball the elastic potential energy is exerted, this can change the rebound height of the ball. Though the higher log drop height of ≈2.15 cm was expected to cause a smaller rebound coefficient, the ball may have bounced higher having oscillated perfectly when contacting and leaving the surface, thus resulting in the same rebound coefficient as the previous height. Theoretically, this luck factor of the point in time that the elastic potential energy is exerted on the ball will have a direct impact on its rebounding height.
Improvements:
In order to solve the issue above, a large number of trials can be conducted, preferably at least 10 for each drop height. Another limitation that can be addressed is human error when releasing the ball, a simple mechanical system can be implemented to release the ball on command without unnecessary spin or force. As for the camera, this is a harder limitation to solve, but a higher frame speed camera (such as 10000 FPS) can be used to better observe the rebound height of the ball. To further explore this topic, a wider range of drop heights can be used as well, not just limited to 2 meters as was in this experiment. By utilizing more and increased drop heights, it will be interesting to see whether this trend will continue for greater heights. I wonder if there will be other external factors that influence the rebound height, and if so, how these will impact the relationship between the rebound coefficient and the drop height of the tennis ball; an extremely thorough experiment can be conducted via the equipment mentioned above to gather accurate data.
- A typical ball bounces to 60% of its original height, influenced by numerous coefficients/data points
http://physicspassion.weebly.com/discussion.html
- Explains the study’s connection to the law of conservation of energy
http://ffden-2.phys.uaf.edu/webproj/211_fall_2014/Max_Hesser-Knoll/max_hesserknoll/Slide4.htm
- Accounts for spin of the ball during contact, and it’s influence on rebound height
https://www.sciencedirect.com/science/article/abs/pii/S1440244003800142
- Correlation between racket head speed and bounce of tennis ball
https://interestingengineering.com/what-are-the-physics-behind-bouncing-balls
- 7 stages of motion of a bouncing tennis ball
Bruce, Morys George Lyndhurst, and Barry Steven Lorge. “Tennis.” Encyclopædia Britannica, Encyclopædia Britannica, Inc., 26 July 1999, https://www.britannica.com/sports/tennis.
Lang, Rocky. “The History of Tennis Balls.” The History of Tennis Balls, Tennisplayer, https://www.tennisplayer.net/public/notes_on_tour/rocky_lang/the_history_of_tennis_balls/?public=true.
Team, AQF. “Tennis Ball Inspection and Quality Control.” Intouch, 24 Apr. 2014, https://www.intouch-quality.com/blog/tennis-ball-inspection-quality-control.
“Tennis Ball.” Wikipedia, Wikimedia Foundation, 4 Nov. 2021, https://en.wikipedia.org/wiki/Tennis_ball.
“The Beauty of Slow Motion - Tennis Ball Bounce.” YouTube, ScienceLuxembourg, 17 Oct. 2017, https://www.youtube.com/watch?v=1yT0hxplVBg. Accessed 5 Mar. 2022.
“The Origins of Tennis - History of Tennis.” The History of Tennis, https://www.tennistheme.com/tennishistory.html.