“What is the effect of a magnet’s distance on the magnetic field?”
Teacher: Christopher Murray
Alayna Huque
Date of Submission: March 28th, 2022
Introduction | Method/Procedure
| Results/Analysis
| Conclusion
| Links | Bibliography | Return to Research
Introduction .:. Top
Background
In 2000, the Millenium Force was built for Cedar Point in Sandusky, Ohio. At the time, this roller coaster broke multiple world records. It was the first giga-coaster, and was the fastest and tallest roller coaster in the world. Today, it is the 3rd longest roller coaster in North America. It is 301 feet tall, has a 300 foot drop, two tunnels, four hills, and much more. The Millenium Force has been voted the number one roller coaster ten times and has never ranked lower than second place. Among these other impressing features, it is also the first roller coaster to use magnetic brakes. (Millenium)
Magnetic
brakes use only magnetic properties. A magnet is placed under the roller coaster
cart and another is placed on the track where the cart comes to a stop. The
magnets have attracting ends so that as the cart approaches the magnet on the
track, the attraction causes the cart to gradually come to a stop. This type of
braking is popular in roller coasters because it is silent and feels smoother
for riders. (How) This occurs because of Coulomb’s law which states that like
charges repel each other, and opposite charges attract each other. Therefore,
two south pole ends of a magnet would repel each other but a south pole end of
a magnet and a north pole end of a magnet charge would attract each other. The
attraction or repulsion that occurs acts along the line between the charges.
Coulomb’s law also states that the intensity of the
magnetic field should equal the inverse of the square of the distance of the
magnetic source (![]() ). So, if the distance is doubled, the intensity
of the field becomes weaker decreasing by ¼ of the original value, and if the
distance shortens by 10 times the intensity of the field would increase by a
factor of 100. (Hosch) The end of the
magnet on the roller coaster cart seemingly should act like a point charge and
the intensity of the magnetic field should change by
). So, if the distance is doubled, the intensity
of the field becomes weaker decreasing by ¼ of the original value, and if the
distance shortens by 10 times the intensity of the field would increase by a
factor of 100. (Hosch) The end of the
magnet on the roller coaster cart seemingly should act like a point charge and
the intensity of the magnetic field should change by ![]() as
the distance increases. Therefore, I would expect there to be a change in the
magnetic field that follows Coulomb’s law as the roller coaster cart magnet
moves on the tracks.
as
the distance increases. Therefore, I would expect there to be a change in the
magnetic field that follows Coulomb’s law as the roller coaster cart magnet
moves on the tracks.
I've always loved riding roller coasters at amusement parks like Disney and Universal Studios, and I have been fascinated by how the carts move using magnetic breaks. It's amazing how they go from such high speeds through loops and drops to a stop using only magnetic properties. This led me to be curious in understanding just how the magnets and magnetic field relate in order to better understand the movement of the roller coaster carts.
Statement Problem and Variables
The purpose of this investigation therefore, was to find the relationship, if any, between the distance of a magnet and the magnetic field. A magnet is defined as a piece of ferromagnetic material (ex. Iron, nickel, steel) that has its component atoms ordered in a way that allows the it to exhibit properties of magnetism, such as having a north and south. (Gaur) Magnetic field is defined as a vector field in the surrounding area of a magnetic material, electric current, or changing electric charges within which the force of magnetism functions. (Gregersen) The controlled variables included, but were not limited to, the magnet pole facing the hall effect probe, the height of the hall effect probe, and the position of the ruler.
Hypothesis
I
believed that (with magnetic field as the dependent variable and the distance
of the magnet as the independent variable) the magnetic field (in mT) would have an inverse square relationship (![]() ). I hypothesized this would
occur because the magnet producing the magnetic field would be moving away from
the object measuring the magnetic field (the hall effect probe), therefore the
readings would grow weaker. I believed it would follow Coulomb’s law because
the end of the magnet would act as a ‘point source’ and give a field that drops
with
). I hypothesized this would
occur because the magnet producing the magnetic field would be moving away from
the object measuring the magnetic field (the hall effect probe), therefore the
readings would grow weaker. I believed it would follow Coulomb’s law because
the end of the magnet would act as a ‘point source’ and give a field that drops
with ![]() as it moved
farther away from the hall effect probe.
as it moved
farther away from the hall effect probe.
Method/Procedure .:. Top
During the experiment a computer, retort stand, clamp, hall effect probe, magnet, ruler, pencil, paper, and tape was used. First, the ruler was laid flat against the table. It was kept straight by alining it with the edge of the table and then carefully moving it towards the center of the table. It was then taped down so that the ruler wouldn’t move as the magnet moved along it during the experiment. The retort stand stood behind the ruler, far enough back so that when the hall effect probe was attached to the clamp, the edge of the hall effect probe would be exactly behind the edge of the ruler and aligned to the right. It was aligned to the right because during the experiment the magnet would be moving along the right side of the ruler, as that was the side of the ruler with the centimeters, so the magnet probe was aligned with the center of the magnet. The clamp held onto the retort stand, it was screwed on extremely tight so that the height of the clamp would not change during the experiment. The clamp was attached at a height on the retort stand so that when the hall effect probe was attached to the clamp, it would lie just above the height of the magnet. The hall effect probe was then attached to the clamp, also very tightly so it wouldn’t move because hall effect probes are sensitive to rotation.
During the experiment, the south pole of the magnet always faced the hall effect probe so that only positive values would be recorded (the south pole is naturally positive and the north pole is naturally negative). As the magnet moved it was aligned with the edge of the ruler in order to ensure it stayed straight. Each time the magnet moved, the hall effect probe sent the data to a computer, and I then wrote down the data on paper using a pencil.
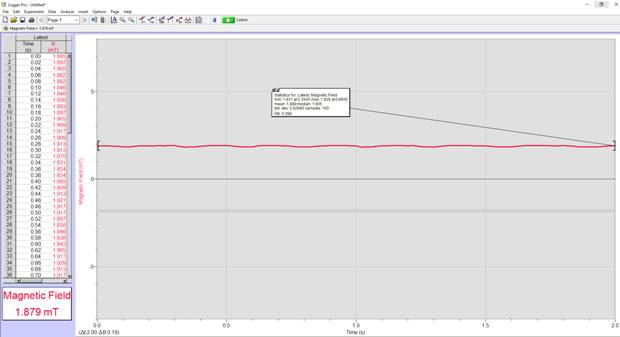
To collect data, the magnet was moved away from the hall effect probe along the ruler one centimeter at a time. The magnet started at 1 centimeter and continued moving back centimeter by centimeter until it was aligned with the 30 centimeter mark on the ruler. The south edge of the magnet was aligned with the centimeter mark on the ruler each time it moved in order to stay consistent. After each centimeter that the magnet moved, the hall effect probe sent the maximum, minimum, and mean of the magnetic field to a computer. The computer took 50 data point samples every 2 seconds. The data points fluctuated due to external magnetic fields, such as electrical wires in the room. I wrote each of the data points that the computer seemed to settle on for the longest, along with the distance the magnet was placed. I recorded data from 1 centimeter through 30 centimeters. I chose to do 1 centimeter through 30 centimeters because 30 variations was an adequate amount of data points to accurately analyze and see the progression of the magnetic field. Also, as seen in the data below, after 30 centimeters there was not much variation in the magnetic field so it was not useful to continue further. I chose to move the magnet in centimeters because the magnetic field changed very quickly, so I needed to measure in small distances. There were no safety or ethics concerns involved in this experiment as none of the materials and the magnetic field could be or were harmful in any way to the environment I was in and the people I was surrounded by. The experiment could not have had any negative repercussions.
Results/Analysis .:. Top
|
Raw Data |
||||
|
Distance (cm) |
Mean (mT) |
Minimum (mT) |
Maximum (mT) |
Uncertainty (mT) |
|
1.0 |
5.0710 |
5.0660 |
5.0780 |
0.0060 |
|
2.0 |
2.7410 |
2.6730 |
2.8490 |
0.0880 |
|
3.0 |
1.7600 |
1.7030 |
1.8710 |
0.0840 |
|
4.0 |
1.2390 |
1.1950 |
1.3350 |
0.0700 |
|
5.0 |
0.9325 |
0.8895 |
1.0150 |
0.0628 |
|
6.0 |
0.7486 |
0.7175 |
0.8075 |
0.0450 |
|
7.0 |
0.6343 |
0.6080 |
0.6862 |
0.0391 |
|
8.0 |
0.5532 |
0.5337 |
0.6001 |
0.0332 |
|
9.0 |
0.5085 |
0.4751 |
0.5494 |
0.0372 |
|
10.0 |
0.4556 |
0.4360 |
0.5024 |
0.0332 |
|
11.0 |
0.4267 |
0.4084 |
0.4672 |
0.0294 |
|
12.0 |
0.4041 |
0.3890 |
0.4476 |
0.0293 |
|
13.0 |
0.3883 |
0.3732 |
0.4202 |
0.0235 |
|
14.0 |
0.3761 |
0.3577 |
0.4084 |
0.0254 |
|
15.0 |
0.3615 |
0.3459 |
0.3969 |
0.0255 |
|
16.0 |
0.3537 |
0.3420 |
0.3890 |
0.0235 |
|
17.0 |
0.3499 |
0.3341 |
0.3811 |
0.0235 |
|
18.0 |
0.3408 |
0.3265 |
0.3732 |
0.0234 |
|
19.0 |
0.3371 |
0.3226 |
0.3732 |
0.0253 |
|
20.0 |
0.3309 |
0.3147 |
0.3617 |
0.0235 |
|
21.0 |
0.3276 |
0.3147 |
0.3656 |
0.0255 |
|
22.0 |
0.3283 |
0.3108 |
0.3617 |
0.0255 |
|
23.0 |
0.3250 |
0.3068 |
0.3538 |
0.0235 |
|
24.0 |
0.3259 |
0.3068 |
0.3499 |
0.0216 |
|
25.0 |
0.3207 |
0.3068 |
0.3538 |
0.0235 |
|
26.0 |
0.3202 |
0.3029 |
0.3459 |
0.0215 |
|
27.0 |
0.3186 |
0.3029 |
0.3420 |
0.0196 |
|
28.0 |
0.3152 |
0.3029 |
0.3459 |
0.0215 |
|
29.0 |
0.3148 |
0.2989 |
0.3459 |
0.0235 |
|
30.0 |
0.3140 |
0.3029 |
0.3420 |
0.0196 |
Data Processing
I chose to put my data points into a graph with error bars, a log log graph, another log log graph based on a few points in the original log log graph, and a linearized graph based on the points in my second log log graph. The graph with error bars showed me the way in which the data changed, such as whether it increased or decreased and whether it was linear. It also allowed me the see if my hypothesis was correct or incorrect in stating that the magnetic field would decrease as the distance of the magnet increased. The log log graph allowed me to put a trendline through my data and see if my data was a power function. The slope of the trendline also helped me analyze if my data followed Coulomb's law because the slope is the degree of the relation between the magnetic field and the distance of the magnet. I then took the points where the most change occurred in the original log log graph and created a second log log graph with a line of best fit. The slope of the line of best fit allowed me to the further analyze if my hypothesis was correct in stating that the data would follow the Coulomb’s law. The linearized graph allowed me to understand whether there was a valid relationship between the variables in my experiment, as my hypothesis relied on a valid relationship existing.
Graph
with Error Bars
This
graph shows my raw data. To create the error bars in the graph I found the
uncertainty. The uncertainty was done by finding the average of the maximum and
minimum of the magnetic field. This was done by following the formula ![]() . For example,
5.0780 was the maximum and 5.0660 was the minimum of my first point. So, to find
the uncertainty I did
. For example,
5.0780 was the maximum and 5.0660 was the minimum of my first point. So, to find
the uncertainty I did ![]() which equaled
0.0060. This graph shows that as the distance of the magnet increased the
magnetic field decreased. The magnetic field decreased very suddenly, and then
at the 15 centimeter mark it levels out and very, very gradually approaches 0.
which equaled
0.0060. This graph shows that as the distance of the magnet increased the
magnetic field decreased. The magnetic field decreased very suddenly, and then
at the 15 centimeter mark it levels out and very, very gradually approaches 0.
Log Log Graph
Since
my data was curved I created a log log graph. A log log graph shows my data
through the equation log(B) = nlog(distance)
+ log(A) (essentially y=mx+b), because
if y = Axn
then log(B) = nlog(distance) + log(A).
To find the log of distance, with distance being distance of the magnet, I
followed the formula log(distance). For example, my first distance data point
was 1 centimeter, so I did log(1) which equaled 0. To find the log of B, with B
being the mean of the magnetic field, I followed the formula log(B). For
example my first mean data point was 5.0710, so I did log(5.0710) which equaled
0.7051. I then created the graph and was able to see that log(B) = nlog(distance) + log(A) of my data was log
(B) = -0.7790x +0.5610. Since my data wasn’t linear it couldn’t be a
power function. The log log graph allowed me to take a closer look into the
change that occured, and I could see that the most
change happened within the first 6 points. The slope of the trendline is around
-1 ,-0.7990 to be exact, which showed that my data didn’t follow Coulomb's law ,![]() .
.
Log Log Graph with a Line of Best Fit of the Points Where the Most Change Happened (First 6 Points)
For
this graph I took the first six data points in my log log graph, since that’s
where the most change occurred, and put a line of best fit through them. This
allowed me to further analyze the slopes between my log log graphs. The first
six points decreased at a very fast rate. The slope of the line of best fit of
the first six points is still around -1 (-1.0800 to be exact), which confirmed
that the my data didn’t follow Coulomb's law. Instead of being ![]() my data was
my data was ![]() .
.
Linearized Graph of the Points Where the Most Change Happened (First 6 Points)
Since
my data was not linear in my original log log graph and didn’t function with
the relationship I hypothesized (Coulomb’s law), I linearized
the points where the most change happened in order to make sure that there was
valid relationship between my variables. A linearized
graph illustrates y1/n vs x (with x being
the distance of the magnet). For my data y1/n was y1/-0.7990
since I learned in the original log log graph that n was -0.7990. I then used
the formula y1/-0.7990, where y was the mean data points of the
magnetic field. For example, the first mean of magnetic field data point was
5.0710 so ![]() which
equaled 0.1311. Although my points still curved slightly (perhaps caused by a
zeroing error with the hall effect probe), the
trendline goes straight up which shows that the relationship between my
variables were valid.
which
equaled 0.1311. Although my points still curved slightly (perhaps caused by a
zeroing error with the hall effect probe), the
trendline goes straight up which shows that the relationship between my
variables were valid.
Conclusion .:. Top
In
conclusion, my hypothesis was only partly correct. In my graph with error bars
the magnetic field dropped very quickly and then leveled out with barely any
change. This occurred because the magnetic field became weaker as the distance
of the magnet from the hall effect probe increased. This is accurate to a
section of my hypothesis. I believe that the magnetic field barely had any
change after it suddenly dropped because of the limits of the hall effect
probe, it may only be able to measure up to a certain distance. The part of my
hypothesis that was incorrect was stating that my data would follow Coulomb’s
law. My log log graphs showed that the data I recorded didn’t follow ![]() but instead
followed
but instead
followed ![]() . This could imply a
geometry like a linear radiant of force (such as a wire that would demonstrate
ampere’s law), or perhaps the hall effect probe was too close to the magnet so
that it couldn’t act as a point charge. I though this may have occurred because
of Earth’s magnetic field. Although, Earth’s magnetic field ranges from 0.2500
gauss to 0.6500 gauss (Earth’s), which is equivalent to 0.000025 teslas to 0.000065 teslas or
0.0250 milliteslas to 0.0650 milliteslas,
which is too small to have made such an impact on the data. It may have
been caused by magnetic fields that were produced from elsewhere in the room
where I conduced the experiment, but because I made the error of not measuring
other possible magnetic fields in the room, the true cause of the result
. This could imply a
geometry like a linear radiant of force (such as a wire that would demonstrate
ampere’s law), or perhaps the hall effect probe was too close to the magnet so
that it couldn’t act as a point charge. I though this may have occurred because
of Earth’s magnetic field. Although, Earth’s magnetic field ranges from 0.2500
gauss to 0.6500 gauss (Earth’s), which is equivalent to 0.000025 teslas to 0.000065 teslas or
0.0250 milliteslas to 0.0650 milliteslas,
which is too small to have made such an impact on the data. It may have
been caused by magnetic fields that were produced from elsewhere in the room
where I conduced the experiment, but because I made the error of not measuring
other possible magnetic fields in the room, the true cause of the result ![]() is
unknown. Although my results followed
is
unknown. Although my results followed ![]() ,
my linearization graph showed that there was still a valid relationship between
the distance of the magnet and the magnetic field. Another error I made that
may have affected my results was forgetting to calibrate the hall effect probe
before I started recording data. This caused an unknown value of error in all
my magnetic field data points, meaning that the magnetic field data points and
the uncertainties were not 100% precise or accurate. Improvements that I would
make for the experiment in the future would be conducting the experiment in an
empty, isolated room so only Earth’s magnetic field is present, or in a room
where all other magnetic fields present are measured. Therefore, the accuracy
of the results could be better understood. I would also make sure to calibrate
the hall effect probe before recording data. I would calibrate the hall effect
probe and record data when the magnet moves from 1 centimeter to 30 centimeters,
and then I would calibrate the hall effect probe again and repeat recording
data from 1 centimeter to 30 centimeters. I would calibrate the hall effect
probe and record data for at least 3 rounds to compare similar data points and
see if there is any variation. This would assist in better understanding how
reliable the data from the hall effect probe is and in knowing the exact value
of error that occurs. In the future, I would also be interested in seeing how
the results change if I had the north side of the magnet facing the hall effect
probe, as the points would be negative. I would also want to see the results of
moving the magnet in smaller increments, such as in ½ centimeters or
millimeters. This would allow me to get more data points during the largest
change in the magnetic field.
,
my linearization graph showed that there was still a valid relationship between
the distance of the magnet and the magnetic field. Another error I made that
may have affected my results was forgetting to calibrate the hall effect probe
before I started recording data. This caused an unknown value of error in all
my magnetic field data points, meaning that the magnetic field data points and
the uncertainties were not 100% precise or accurate. Improvements that I would
make for the experiment in the future would be conducting the experiment in an
empty, isolated room so only Earth’s magnetic field is present, or in a room
where all other magnetic fields present are measured. Therefore, the accuracy
of the results could be better understood. I would also make sure to calibrate
the hall effect probe before recording data. I would calibrate the hall effect
probe and record data when the magnet moves from 1 centimeter to 30 centimeters,
and then I would calibrate the hall effect probe again and repeat recording
data from 1 centimeter to 30 centimeters. I would calibrate the hall effect
probe and record data for at least 3 rounds to compare similar data points and
see if there is any variation. This would assist in better understanding how
reliable the data from the hall effect probe is and in knowing the exact value
of error that occurs. In the future, I would also be interested in seeing how
the results change if I had the north side of the magnet facing the hall effect
probe, as the points would be negative. I would also want to see the results of
moving the magnet in smaller increments, such as in ½ centimeters or
millimeters. This would allow me to get more data points during the largest
change in the magnetic field.
Links .:. Top
https://science.howstuffworks.com/magnet.htm - More detail about how magnets work
https://www.livescience.com/38059-magnetism.html - About magnetism, magnetic field, and magnetic force
https://web.ua.es/docivis/magnet/earths_magnetic_field2.html - Explanation about Earth’s magnetic field
https://en.wikipedia.org/wiki/Brake_run - About roller coaster breaking systems, including magnetic brakes
https://www.hsmagnets.com/blog/magnets-used-roller-coasters/ - More about how magnets are used for roller coaster breaks
https://en.wikipedia.org/wiki/Millennium_Force - A famous roller coaster that uses magnetic breaks
https://www.britannica.com/science/Coulombs-law - Explanation about Coulomb’s Law
Bibliography .:. Top
Earth's Magnetic Field, Blended Learning Labs Practice,
https://web.ua.es/docivis/magnet/earths_magnetic_field2.html.
Gaur, Aakanksha, et al. “Magnet.” Encyclopædia Britannica, Encyclopædia Britannica, Inc., 9
Apr. 2008, https://www.britannica.com/science/magnet.
Gregersen, Erik, et al. “Magnetic Field.” Encyclopædia Britannica, Encyclopædia Britannica,
Inc., 24 Jan. 2007, https://www.britannica.com/science/magnetic-field.
Hosch, William, et al. “Coulomb's Law.” Encyclopædia Britannica, Encyclopædia Britannica,
Inc., 3 Feb. 2009, https://www.britannica.com/science/Coulombs-law.
“How Are Magnets Used in Roller Coasters?” Magnets By HSMAG, 28 Feb. 2017,
https://www.hsmagnets.com/blog/magnets-used-roller-coasters/.
“Millennium Force.” Wikipedia, Wikimedia Foundation, 9 Jan. 2022,
https://en.wikipedia.org/wiki/Millennium_Force.