Jacob Schroeder & Cole Carlile
Spring Constant Lab
Background | Questions | Materials | Picture | Procedure | Data | Conclusion | Links | Bibliography | Return to Research
Background:
Springs have been a staple of the world since the beginning of time. Whether it be in ancient civilizations who used a variation of a non-coiled spring for bows, or in the Bronze age when tweezers became popular in many cultures. The elastic object conducts the function of storing mechanical energy and then releasing it. One key factor in determining the amount of energy in the spring is to determine the spring constant or the overall stiffness of a spring. The higher the constant is, the stiffer the spring is. The problem is, there is not one set constant since springs are made from materials, become stiffer with age, etc. Leading Cole and I to wonder: what is the constant of one of the springs in Mr. Murray’s room? Top
Independent Variable: Mass added to Spring
Dependent Variable: Time
Constants: Spring, Stand, Weight Holder, Stopwatch, Data Collector
Question: By determining the period of the spring with different weights, what is the spring constant? Top
Set of weights (ranging from 10 to 900 grams)
Weight holder (20 grams)
Coil spring
Stand to hold spring and weight holder
Stopwatch Top

I started by testing the amount of time it took for the 20g weight holder to complete ten full periods since trying to get just one would be too quick, increasing the chance of errors. Then proceeded by adding weight up to 900g to record the different set of periods. After recording the time for ten periods, I would then divide each by ten for every single period. Also, I would divide the mass by 1,000 to convert from grams to kilograms. Then, by using the time and mass, I would plug it into the equation: T = 2pi (m/k) ^½ to determine k (spring constant). But, in order to have a linear graph, you have to square both sides. Leaving the equation as T^2 = 4 pi^2 (m/k). Top
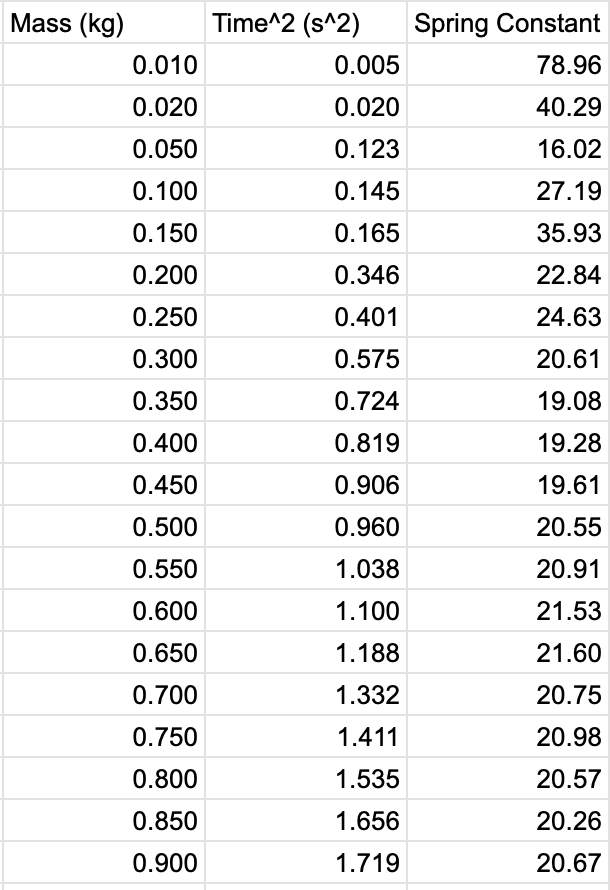
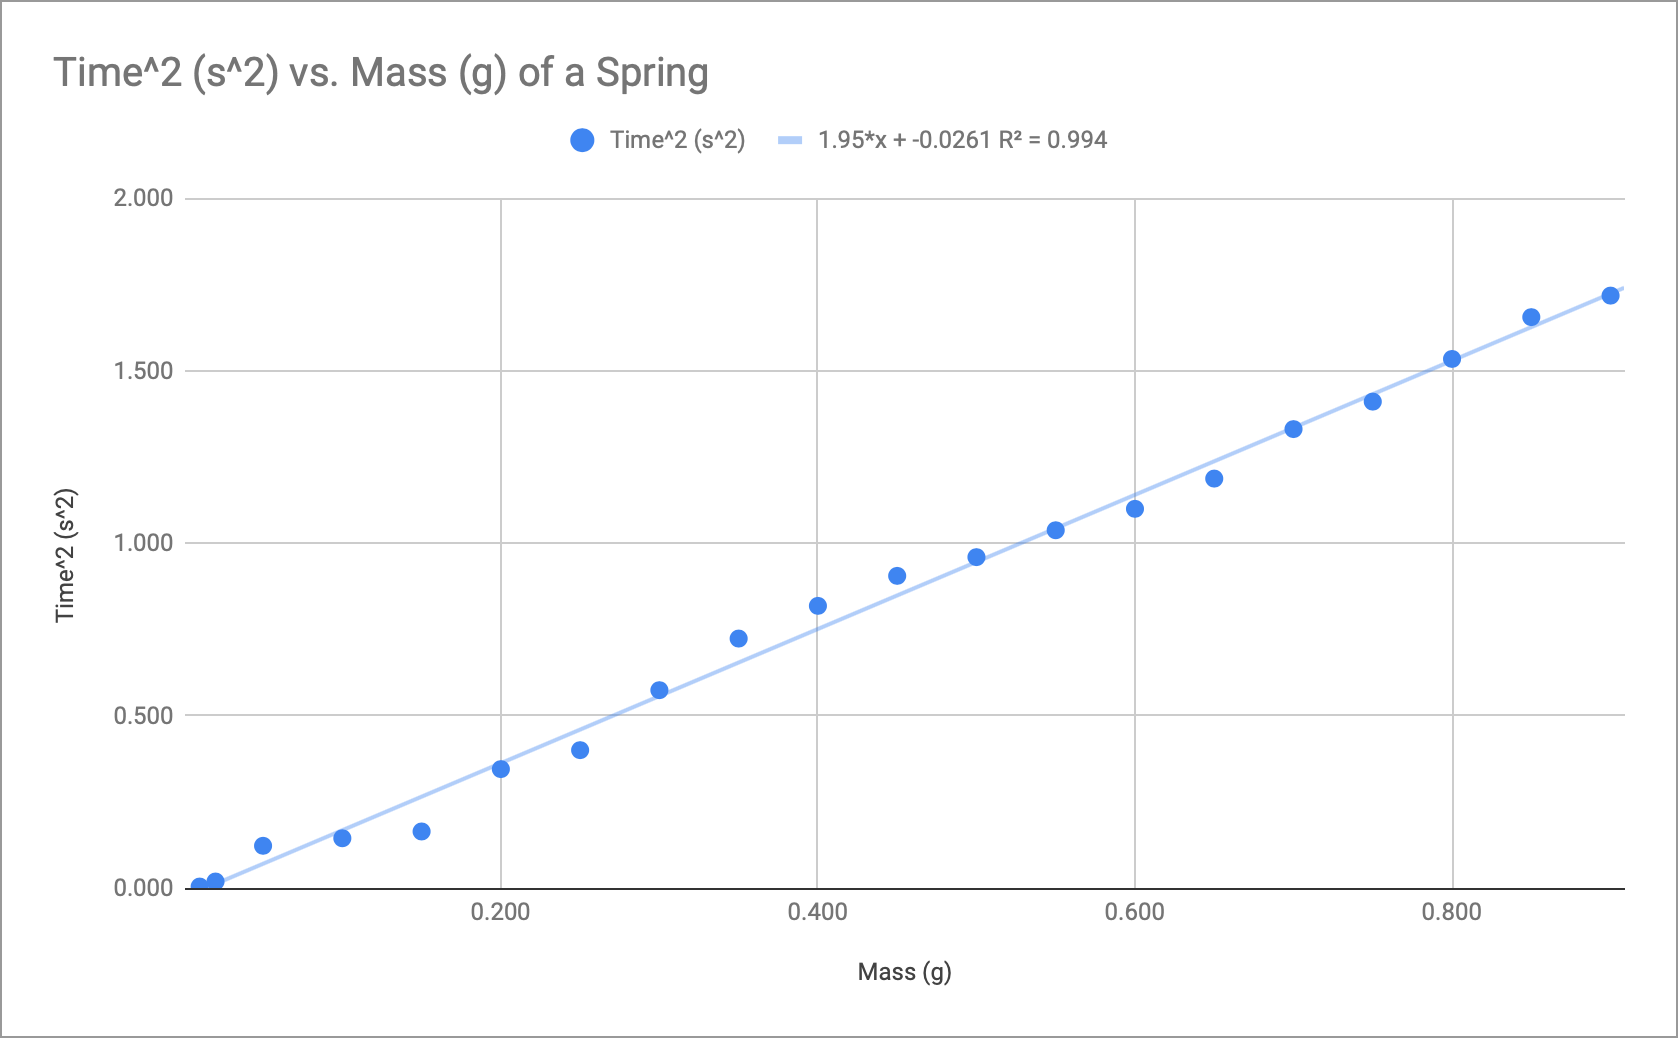
Above is the final data table after the mass has been changed from grams to kilograms, the time has been divided by ten and then ultimately squared and then the results for the spring constant. It can be seen that k is kind of all over the place at the beginning but that is due to the time of the lighter mass’ periods being so quick, making it harder to get an exact number. Eventually, at the heavier masses, the constant levels out around 20 newtons/meter. In order to check our calculations, we graphed the data for T^2 vs m which can be seen above as well. After plotting all of the points, we formatted the graph to find the line of best fit (LOBF). Seeing that the slope of LOBF was 1.95 s^2/g, we plugged it into the equation 4pi^2/k = slope. The result we got for k was 20.25 N/m. This means we were nearly exactly correct, to see just how close, we checked the value for R^2. R^2 stands for the coefficient of determination, which is the statistical measure for seeing how close our data is to the LOBF. The closer the value is to one, the more accurate the data is. With our coefficient being 0.994, this means we were only slightly off, most likely due to the data from the lighter weights mentioned earlier. We decided to not include error bars though since there is no possibility of an error with the weights and it would be only a slight error with time, hardly even affecting the overall outcome and graph for the lab. Top
The spring constant for the one we tested was approximately 20 N/m, which fits into the range provided by Mr. Murray that students had gotten in years past, which was between 10 - 30 N/m. Some weaknesses or errors could have arisen during the collection of the data. Since I was the only one there, no one was able to check or even to make the process easier, because I had to release the weight holder and start the timer at the same time. While having someone there may have overall helped the validity of the data, I’m not sure how you can quantify it considering the value of the coefficient of determination was almost exactly one, and how close the projected value of k and the actual value of k were. To summarize, I am impressed with what I have learned in this lab. Could there be slight improvements in the lab? Of course, no lab is always perfect or exact. But I look forward to seeing how helpful springs are in the future, just as they were in the past. Top
https://blog.minitab.com/blog/adventures-in-statistics-2/regression-analysis-how-do-i-interpret-r-squared-and-assess-the-goodness-of-fit (For more information about R^2)
https://www.education.com/science-fair/article/springs-pulling-harder/ (For more information about the spring constant)
https://en.wikipedia.org/wiki/Spring_(device) (For more information about springs)
http://tuhsphysics.ttsd.k12.or.us/Research/IB09/HougBlat/index.htm (Another lab about springs)
https://www.mcmaster.com/compression-springs (To buy springs) Top
Editor, Minitab Blog. “Regression Analysis: How Do I Interpret R-Squared and Assess the Goodness-of-Fit?” Minitab Blog, Minitab Blog, blog.minitab.com/blog/adventures-in-statistics-2/regression-analysis-how-do-i-interpret-r-squared-and-assess-the-goodness-of-fit.
Education.com. “Spring Constants: Equations & Calculations | Science Project.” Education.com, 2 Apr. 2014, www.education.com/science-fair/article/springs-pulling-harder/.
“Spring (Device).” Wikipedia, Wikimedia Foundation, 7 Jan. 2019, en.wikipedia.org/wiki/Spring_(device)#Hooke's_law.
The Effect of Temperature on Magnet Strength, tuhsphysics.ttsd.k12.or.us/Research/IB18/TJohnson/index.htm#_top. Top