Introduction | Procedure and Design | Data Analysis | Figure 1 | Figure 2 | Conclusion
| Links | Go Up
Evan
Malhi
Spring
2019
Introduction:
Back to Top
Basketball is a sport that has been
played around the world for decades. There are so many ever-changing pieces to
the sport, such as the size of the court, play style, size of the backboard,
color of the backboard, etc. However, one thing that has stayed nearly the same
throughout time is the ball. It is has always been played with a ball and
always will be. The size of the ball has nearly stayed the same throughout time
as well.
The sole thing that is crucial for the
ball to function is the air which is pumped into the ball. Too little air and
the ball will be flat and won’t bounce enough for the game to be played
efficiently. Too much air and the ball will be too hard and it will be
difficult to grasp as well as bounce too much. One way that air in the ball can
be measured by the air pressure. Therefore, it is important to assess how air
pressure can affect the rebound height of the ball.
This experiment will research the
relationship between the air pressure inside a basketball and its rebound
height.
Procedure and Design: Back to Top
Materials: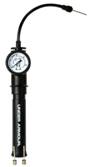
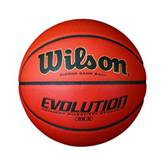
● Official Sized Basketball (29.5 inch
circumference)
● Air Pump with Pressure Gauge in PSI
● Meter Stick
● Phone Camera to Record
● A Flat Surface
● Someone to Help Hold Meter Stick
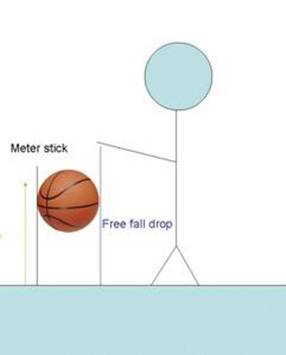
To begin, take the pressure of the basketball down to 5.5
PSI using the pump with the pressure gauge. Then get a partner to hold the
meter stick straight up with the one end touching the ground. Line up the
basketball so that the bottom of the ball is in line with the top of the meter
stick. Hold phone camera and start to record a video where the whole meter
stick and ball are in the frame. Then drop the ball and be sure to try to put
as little outside force as possible on to the ball. Wait for the ball to drop
and and bounce back up once. When the ball has bounced up once, stop the
video and look at the video to determine how high the ball was at its peak
after the bounce. Record this, in centimeters, as the first trial rebound
height for 5.5 PSI. Repeat these steps until 5 trials are obtained for the current
pressure. Then increase the pressure by 0.5 PSI and repeat steps. Keep
repeating steps until data is gathered through 9 PSI.
In this experiment, I will be testing
how the pressure inside a 29.5 inch circumference basketball affects its
rebound height. The independent variable will be the pressure inside the
basketball as it will change as more air is pumped in. The dependent variable
will be the rebound height of that basketball as that depends on the pressure.
By dropping each ball from the same height, I am making sure that my data is as
accurate as possible. I chose to record to the centimeter, not the millimeter,
because it is easier to see the centimeter marks in the video than it is the
millimeter marks.
Data Analysis: Back to Top
Table
1
|
Pressure (PSI) |
5.5 |
6 |
6.5 |
7 |
7.5 |
8 |
8.5 |
9 |
|
Trial 1 (cm) |
23 |
32 |
38 |
45 |
52 |
59 |
64 |
69 |
|
Trial 2 (cm) |
22 |
31 |
40 |
43 |
54 |
60 |
64 |
70 |
|
Trial 3 (cm) |
23 |
34 |
38 |
45 |
55 |
57 |
65 |
68 |
|
Trial 4 (cm) |
24 |
33 |
37 |
46 |
53 |
57 |
66 |
69 |
|
Trial 5 (cm) |
21 |
33 |
39 |
44 |
54 |
59 |
64 |
71 |
|
Average (cm) |
22.6 |
32.6 |
38.4 |
44.6 |
53.6 |
58.4 |
64.6 |
69.4 |
Figure 1 Back to Top
Figure 2 Back to Top
Table 1 shows the data that was
collected for each pressure during the experiment. These data points were then
averaged to get the average rebound height. Figure 1 displays the rebound
height for each trial on one scatter graph. There are five points for each
pressure. While there is not a lot of change in the rebound height between
trials, there is still some. Figure 2 displays the average rebound height for
each trials on one graph with a trend line (black
line) through the points. The coefficient of determination, which is 0.9919, is
taken from this line of best fit. There is also the most
steep line (red line) which connects the smallest rebound height to the
largest rebound height. Conversely, there is the least steep line (purple line)
which connects the highest rebound height for the lowest pressure with the
lowest rebound height for the highest pressure.
Since the coefficient of determination
is so close 1, this means that the dependent variable, the rebound height, can
be easily predicted from the independent variable, the pressure in the ball. By
taking the square root of the coefficient of determination, I can find the
coefficient of correlation, which is 0.9959. This means that an increase in the
independent variable, the pressure in the ball, has a strong increase on the
dependent variable, the rebound height. This can also be seen in the trend line
in Figure 2.
In addition, the slope of the steepest and least steep line show the effect
that the pressure has on the rebound height. The slope of the least steep line
is 12.571. This means that for every PSI the pressure increases, the rebound
height increases by 12.571 cm. Conversely, the slope of the steepest line is
14.286. This means that for every PSI the pressure increases, the rebound
height increases by 14.286 cm. Therefore, based off of my results, the rebound
height of a basketball will increase somewhere between 12.571 cm and 14.286 cm
for every PSI the pressure in the ball is increased. If the pressure decreases,
then the value the rebound height decreases by is the same as when it
increases.
Conclusion: Back to Top
It can be seen that the linear model
fits the data very well, given that the coefficient of correlation is 0.9959.
A possible experiment to go off of
this one would be to see how much the type of surface the ball is bouncing off
of affects the rebound height. I did my experiment on tile in my house but one
could test it on a basketball court, blacktop, carpet, etc. I would assume that
bouncing the ball off of surfaces such as carpet will cause a much smaller
rebound height than bouncing it off of a basketball court or a blacktop.
One way to make the experiment
stronger would be if there is a very precise way to measure the pressure. While
I did use a pump with a pressure gauge, there is always the possibility that
the gauge could be slightly off or that I did not get the pressure to exactly
where it needs to be. I think if this is done it will make the trend in the
data even more linear than it is now. Also I think there are
much better way to find the exact height that the ball rebounded. While I think
my procedure was very good, there are improvements that could be made if better
resources are available. Also, I used the slow motion feature on my phone’s
camera to try and capture as many frames per second, but if one was able to use
a better camera they could capture more frames to get the data to be more
accurate and possibly be able to record down to the millimeter depending on the
clarity of the video.
In addition, it is inevitable that
there is a miniscule change in pressure with each bounce of the ball. Even
though this difference is very small, it could possibly have had an effect on
the data after multiple bounces. It was also pertinent to make sure that no
force was exerted on the ball when it was dropped. While this was nearly
impossible for one to do, it is something that could be improved about this
experiment in the future. One could develop some sort of apparatus that could
drop the ball without exerting any force on it.
In conclusion, the results of this
experiment were as I expected. The pressure inside the ball has a great
influence on the rebound height of the ball and both increase and decrease
together.
Links: Back to Top
https://www.livestrong.com/article/411163-does-air-pressure-affect-the-bounce-of-a-basketball/
- General overview of what could affect the rebound height
https://www.scientificamerican.com/article/surface-science-where-does-a-basketball-bounce-best/
- Really good experiment that is basically the same
https://www.researchgate.net/figure/The-basketball-rebound-height-with-varying-internal-absolute-pressure-when-dropped-from_fig8_274248017
- Good graph of what happens when pressure is changed
http://cssf.usc.edu/History/2002/Projects/J0204.pdf
- Very professional experiment done in California
https://wright.nasa.gov/airplane/pressure.html
- Definition of pressure in an area with force