The
Effect of Temperature of Engine Oil on Viscosity
By Jacob Harvey
Period 6
Background / Procedure and Design
/ Materials / Experiment / Procedure / Calculations / Important Measurements / Results
/ Calculating Error / Graphing Data / Evaluation / Conclusion / Links / Bibliography / Return to Research
The invention of the gasoline combustion engine changed the lives
of millions of people around the world, helping humans traverse land much
faster than possible via horse or on foot. However, the refined technology of
modern gasoline engines is taken for granted by many. One of the most important
things an engine requires in order to function (besides fuel and air) is oil,
whether it be mixed with the fuel in a two-stroke application, or utilized
outside the combustion chamber in a four-stroke design. Having participated in
motocross racing and blown up my own fair share of engines, I wanted to better
understand the variables that allow engine oil to lubricate, especially at
different temperatures. Considering the Pacific Northwest experiences
significant changes in temperature year round, understanding the way heat
affects the viscosity of engine oil is keen in preserving the life of a four
cycle gasoline engine. If engine oil is too viscous, it can cause the engine to
lose its efficiency, but if it is too thin, you risk causing permanent damage
to the engine.
According
to Sciencebuddies.com, viscosity can be calculated using the following
equation/method (answer in g/cm·s):
“The variable commonly used to represent viscosity is the Greek
letter "eta" (η). The variable commonly used to represent
density is the Greek letter "rho" (ρ) ... The other
variables in the equation are g, for the acceleration due to gravity
(981 cm/s2), a for the radius of the sphere (in cm), and v
for the average velocity of the sphere as it falls through the fluid (in cm/s).
The result is in units of poise (g/cm·s).”

Research question: What is the relation
between temperature and viscosity of 10w-30 motor oil, and how does the
potential change in viscosity allow engine oil to lubricate at high and low
operating temperatures?
Hypothesis:
I hypothesize that as
the temperature of the oil approaches normal engine operating temperatures
(90º-100º C), the viscosity will decrease exponentially (become thinner) before
leveling off, because the marble will fall faster as the viscosity decreases.
Variables:
In my experiment, the independent
variable I changed was the temperature in Celsius of the 100ml of 10w-30
oil. The dependent variable was the rate at which the marble fell through
the 100ml of oil inside the graduated cylinder, which I used to calculate
another dependent variable, the viscosity of the fluid at each given
temperature. The variables of my research which remained constant
included the marble’s radius, volume and mass, the volume of the mass of the
oil, the distance traveled by the marble, the change of density (density of
marble - density of oil), and the acceleration of gravity (981 cm/s/s).
Chevron supreme 10w-30 motor oil
100ml Graduated Cylinder
Thermometer (able to read
decimals of degrees)
Marble (1.5875cm diameter)
Spoon (for retrieving the
marble)
Tweezers (for dropping the marble at the surface of the oil)
Stopwatch (phone app)
Video Recording Device (Ipad)
Hot Plate (for heating the
oil)
Ice (for cooling the oil)
Pan (placed the graduated
cylinder inside with water to manipulate temperature)
Scale (measuring weight of
oil and marble in grams)
Newspaper (For cleanup)
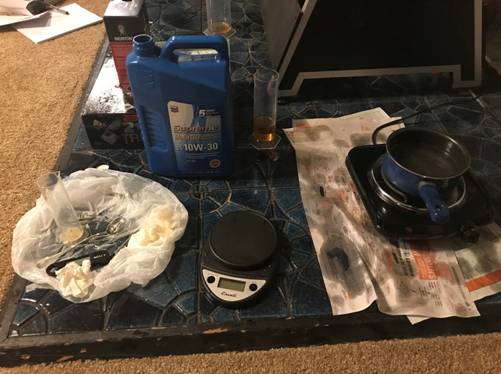
For my experiment, after
laying out a few newspapers in my workspace, I poured 100ml of Chevron supreme
10w-30 motor oil into a graduated cylinder. I took a marble and measured the
diameter (1.5875cm) and mass (6g), then measured the depth of the graduated
cylinder from the 100ml mark (11.5cm), and the mass of the 100ml of oil (87g)
to use in my viscosity calculations later. Throughout my experiment, I utilized
the same marble and the same volume and type of oil. Since my experiment relies
on changing the temperature of the oil in the graduated cylinder, I placed the
graduated cylinder in a pot of water, and either heated it on a hotplate to
increase the temperature or added ice to the pot to decrease it. To gather my
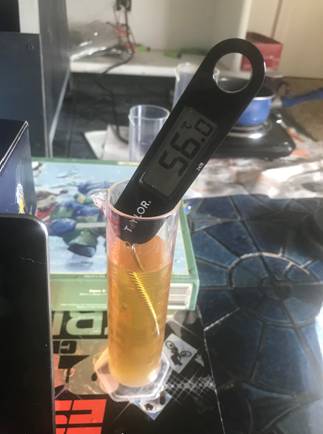
data, once I manipulated and measured the temperature of the oil using a
thermometer, I set the graduated cylinder next to my phone with the stopwatch
app running in front of an Ipad, and recorded
slow-motion video as I dropped the marble from just below the surface of the oil
using a pair of tweezers. After the marble reached the bottom of the graduated
cylinder, I stopped the video and retrieved the marble from the oil with a
spoon, added more oil if necessary, and repeated the experiment so I would have
3 points of data for each temperature value. Once I had three videos per each
temperature value, I reviewed the footage and calculated the change in time by
subtracting the time shown on the phone when the marble reached the bottom by
the time displayed when the marble began to fall. Using Google sheets, I made a
table of the temperature and the recorded fall times, and graphed a scatter
plot of oil temperature vs. time taken for the marble to drop, as well as oil
temperature vs. the average time taken to drop. I also calculated uncertainty
of the average time, and used the distance traveled by the marble divided by
the average time to calculate the average velocity in cm/s of the marble.
Finally, by calculating the change in density, radius of the marble, and the
average velocity of the marble, I was able to calculate the viscosity of the
oil (see Calculating Viscosity), and graphed the temperature vs.
each time taken to fall, temperature vs. average time, and temperature vs.
viscosity.
Calculating Viscosity:
Using the formula from the
sciencebuddies.com website, I was able to calculate viscosity using the data I
gathered. However, I first had to calculate the change in density (density of
marble subtracted by density of the oil = 1.9943 g/cm3), and the average
velocity of the marble at each temperature (v=cm/s, 9.9125cm / avg. marble drop
time). I used the following variables to plug into my equation, recorded
viscosity in g/cm*s, and graphed the results.
Calculated Variables
Δρ
(change in density) = 1.9943 g/cm3 g(gravity)=981
cm/s/s a(radius of marble)=0.79375cm
v(velocity of
marble)=cylinder depth (9.9125cm) / Avg. time (s) recorded at a given
temperature

Small
marble diameter = 1.5875cm
Small
marble mass = 6g
Distance
traveled by marble (11.5cm-1.5875cm) = 9.9125cm
100ml of
Chevron supreme 10w-30 motor oil
Mass of
100ml of oil = 87g
|
Times in s |
|||||||
|
Temperature(ºC) |
Trial 1 |
Trial 2 |
Trial 3 |
Avg. Time |
Uncertainty (+/-) |
Avg Velocity (cm/s) |
Viscosity(g/cm*s) |
|
2 |
1.14 |
1.18 |
1.11 |
1.1133 |
0.035 |
8.9037 |
30.7640 |
|
4 |
1.05 |
0.99 |
1.08 |
1.0400 |
0.045 |
9.5313 |
28.7385 |
|
8 |
1.00 |
0.98 |
1.10 |
1.0267 |
0.060 |
9.6547 |
28.3710 |
|
12 |
0.81 |
0.69 |
0.73 |
0.7433 |
0.060 |
13.3358 |
20.5398 |
|
16 |
0.55 |
0.67 |
0.61 |
0.6100 |
0.060 |
16.2500 |
16.8563 |
|
20 |
0.48 |
0.46 |
0.48 |
0.4733 |
0.010 |
20.9434 |
13.0788 |
|
24 |
0.46 |
0.44 |
0.47 |
0.4567 |
0.015 |
21.7046 |
12.6201 |
|
28 |
0.41 |
0.48 |
0.46 |
0.4500 |
0.035 |
22.0278 |
12.4349 |
|
32 |
0.43 |
0.38 |
0.40 |
0.4033 |
0.025 |
24.5785 |
11.1445 |
|
36 |
0.35 |
0.36 |
0.34 |
0.3500 |
0.010 |
28.3214 |
9.6716 |
|
40 |
0.33 |
0.31 |
0.34 |
0.3267 |
0.015 |
30.3413 |
9.0278 |
|
44 |
0.30 |
0.32 |
0.28 |
0.3000 |
0.020 |
33.0417 |
8.2900 |
|
48 |
0.28 |
0.31 |
0.27 |
0.2867 |
0.020 |
34.5745 |
7.9224 |
|
52 |
0.29 |
0.27 |
0.30 |
0.2867 |
0.015 |
34.5745 |
7.9224 |
|
56 |
0.29 |
0.26 |
0.27 |
0.2733 |
0.015 |
36.2697 |
7.5522 |
|
60 |
0.28 |
0.30 |
0.29 |
0.2900 |
0.010 |
34.1810 |
8.0136 |
|
64 |
0.24 |
0.26 |
0.27 |
0.2567 |
0.015 |
38.6151 |
7.0934 |
To calculate the error for each average time, I subtracted the
highest time value by the lowest time value, and then divided the result by 2.
To best display my results, I made scatter plot graphs and drew exponential
lines of best fit. I chose the scatter plot as my graphing format because my
data creates a spread, yet still generally fits a negative exponential curve.
This shape is the reason I used an exponential trend line in each of my graphs.
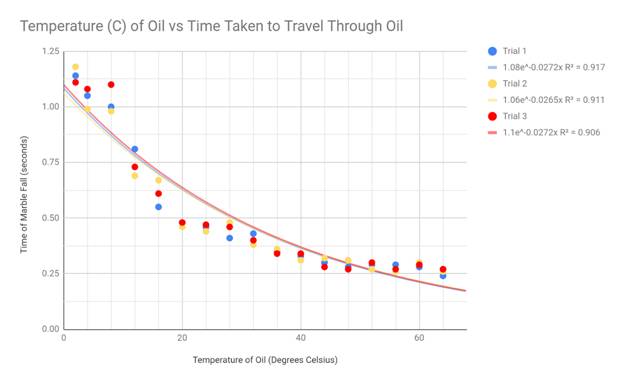
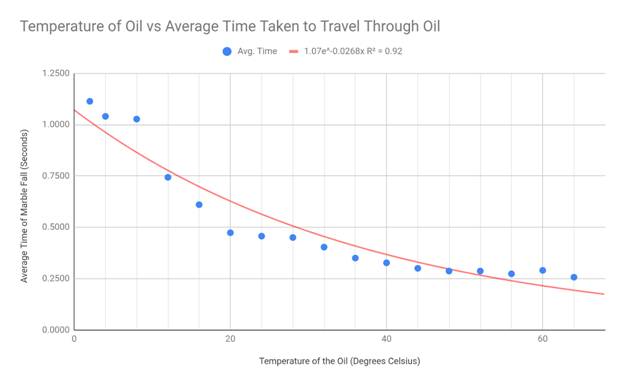
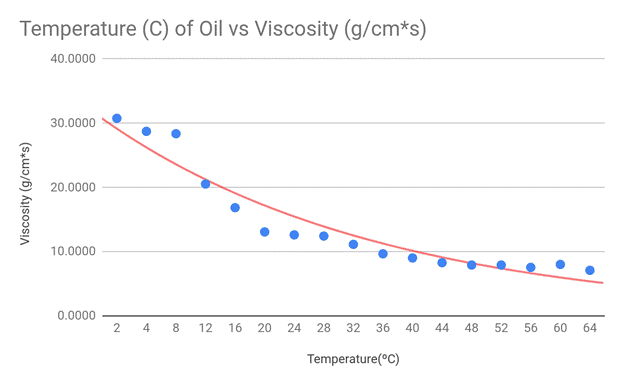
My hypothesis stated that the viscosity should suggest an exponentially
negative correlation with the temperature of the engine oil, and this
correlates with my data. Although there are some outliers present in the
extremes of my data (cold and hot temps), the exponential decay trend line fits
my graph the best. Because the viscosity equation divides my constant variables
by 9*velocity, and the velocity of the marble increased with temperature, my
data appears in an exponential fashion.
When applying these results
to real-world mechanics, there are some important things to consider. 10w-30
motor oil is engineered to act as single viscosity 10w grade oil at cold
temperatures, but at normal operating temperature it will have the viscosity of
30 grade oil.
Although certain facets of my experiment such as the thermometer reading
degrees to the tenth and the use of video analysis for timing the marble drop
helped control some of the error in my data, there are some key points which
may have caused errors. One of the most prominent facets of my research that
produced error was when dropping the marble using tweezers, the marble would
run the risk of hitting the side of the graduated cylinder before reaching the
bottom, or the tweezers would accidently grip the marble when trying to release
it. This could be addressed by creating a better system for dropping the
marble more instantly and vertically.
Other sources of error
include the nature of my measurement devices, including my thermometer, ruler,
and scale, and these issues could be addressed with more advanced/precise
methods of measurement. Another struggle I encountered was that it became
increasingly difficult to accurately record times when the temperature
approached hotter temperatures, as the marble would take less than a third of a
second to reach the bottom of the graduated cylinder.
Additionally, I struggled to
keep temperature constant while collecting data for extreme temperatures,
specifically with heat. This was likely due to the fact that I conducted my
experiment in a cold basement (approximately 16º C), and if the environment
could be adjusted to match the temperature of the oil, this would have less
effect on my research.
Here’s
a similar experiment: http://csef.usc.edu/History/2003/Projects/J1531.pdf
This
is the engine oil I used, Chevron 10w-30, for sale on Amazon: https://www.amazon.com/Chevron-Supreme-10W-30-Motor-Oil/dp/B00M1Y2S44
Chevron’s
official site: https://www.chevron.com/
This
site has background info for a simplified version of the experiment: https://www.sciencebuddies.org/science-fair-projects/project-ideas/MatlSci_p019/materials-science/viscosity-of-motor-oil.
More background on engine oil viscosities: https://www.motorstate.com/oilviscosity.htm
Elert,
Glenn. “Viscosity – The Physics Hypertextbook.”
Free Fall – The Physics Hypertextbook,
1998, www.physics.info/viscosity/.
Renneboog,
Richard M.J. “Oil Viscosity.” ScienceIQ.com, www.scienceiq.com/Facts/OilViscosity.cfm.
“What Does SAE 10W-30 Stand For?” Tomorrows Technician, 18
Nov. 2017, www.tomorrowstechnician.com/service-advisor-what-does-sae-10w-30-actually-mean/.
Science
Buddies Staff. "The Viscosity of Motor
Oil." Science Buddies, 28 July 2017, https://www.sciencebuddies.org/science-fair-projects/project-ideas/MatlSci_p019/materials-science/viscosity-of-motor-oil. Accessed 24 Feb.
2019.