Pressure and Distance Soccer Ball Lab
Table of Contexts: Background | Purpose | Experimental Variables | Constants | Errors | Materials | Procedures | Conclusion | Return to research
Background: Top
A soccer ball during a soccer match can often be during a match can often be affected by the pressure the ball contains. There is often never a standardized
Pressure (PSI) in the soccer ball which can affect the distance when kicked in the situation of a soccer game. So the purpose of this investigation was to determine how the change of air pressure affects the distance on a soccer field when kicked as hard as possible. The law that is related to this investigation is Newton’s first law, which states that every object will remain at rest or in uniform motion in a straight line unless compelled by another state. It is related by me kicking a ball until it is changed in motion when it hits the ground, which is how I collected my date.
The goal was to determine the distance of a soccer ball when changing the pressure various times going in intervals of two from 0 PSI to 8.5 PSI. For my experiment I would continue to use the same ball for no possible differences with other soccer balls that I have, but I would use a pump that calculated the pressure the soccer ball would obtain. Overall, the purpose is pretty simple, which is to show how pressure and distance of the ball have a positive relationship.
Independent Variable: The Independent Variable was the air pressure in the soccer ball I used throughout the experiment. I modified it by going up in increments of two PSI from 0 to 8.5 PSI
Dependant Variable: The Dependant Variable was the distance and how I measured it. When I would kick the ball I could not see where it landed, so I had my little cousin determine the exact yard of where it landed.
Throughout my experiment I had two constants; I used the same soccer ball for each trial and ran up to the ball in the same amount of steps. I completed this by taking 5 steps back from the start of the field and marked it with my water bottle.
My experiment from the beginning was at risk to contain many errors. Something that would not always be constant was the force used to kick the ball with. I would kick it as hard as possible, but doesn’t mean it would be the same force each time. Secondly, the wind would be an external factor in the experiment as well by skewing the distance of the soccer ball after kicking it. Another factor to take a look at is the direction the way the ball is going. Although I took five trials and averaged it, if the ball was kicked to diagonal then the distance could possibly be an outlier.
· Ball Pump
· Soccer Ball
· Little cousin to determine where it lands
· Right leg
- Kick one time to see where to expect the landing
- Kick Soccer ball five times and gather data on distance
- Change the air pressure of the ball five different times
- Gather date for the different pressures and differences
Setup: 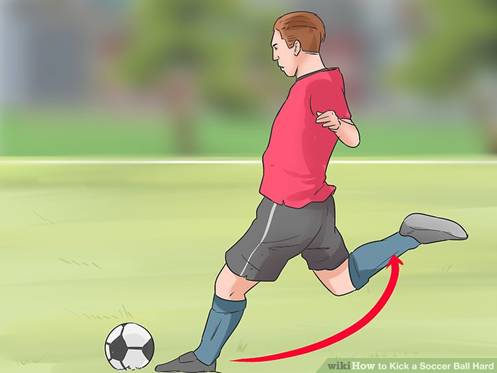
Data:
|
Distance |
Pressure |
|
13.2 |
0 |
|
21 |
2 |
|
27.9 |
4 |
|
31.1 |
6 |
|
40.9 |
8.5 |
Raw Data:
|
Distance |
Pressure |
|
11.2 |
0 |
|
12.3 |
0 |
|
14 |
0 |
|
15 |
0 |
|
13 |
0 |
|
21 |
2 |
|
23 |
2 |
|
19.5 |
2 |
|
21 |
2 |
|
22 |
2 |
|
26.8 |
4 |
|
27.5 |
4 |
|
29 |
4 |
|
28.5 |
4 |
|
27 |
4 |
|
30 |
6 |
|
32 |
6 |
|
31.5 |
6 |
|
33 |
6 |
|
31 |
6 |
|
42 |
8 |
|
44 |
8 |
|
43.5 |
8 |
|
39 |
8 |
|
39.5 |
8 |
In the first data table I took the average of all five trials and put it into a scatter plot and it was very linear showing that there is a positive relationship. That if the pressure on the ball goes up then the distance goes up. In the second graph where the raw data is shown the trend line isn’t near a lot of the data points which can show the margin of error throughout the experiment. This supports Newton’s first law of how the soccer ball will stay in motion unless acted upon by another force.
In conclusion, the experiment overall could have had many errors that may have occurred. But it shows the correlation and relationship distance and pressure has. An obvious limitation is the idea of how wind, a different force acted on the ball and direction of the ball could have affected the ball. Also my little cousin telling me where the ball was landing could massively affect the distance of the ball. But overall gives a sense of how pressure can affect the distance and direction of a ball.
Related Topics:
https://www.education.com/science-fair/article/physics-soccer-ball/ Gives you a sense of what materials to use
https://prezi.com/jilgxm1ilqzs/do-different-air-pressures-affect-how-far-a-ball-can-go/ A Prezi on a similar experiment that gives you ideas on possible ways to change it
https://sciencing.com/science-fair-projects-involving-soccer-ball-12207633.html This link talks about the spin and how it could affect the distance of the ball
https://www.livestrong.com/article/412822-how-does-the-air-pressure-of-a-soccer-ball-affect-the-distance-it-goes-when-kicked/ Article of possible errors
http://tuhsphysics.ttsd.k12.or.us/Research/IB15/MizuZhaoYounHugh/index.htm Students a few years back that did the same experiment (they probably did a better job)