The relationship between the draw distance of a slingshot and
velocity
Nathan Platter
Background:The slingshot was invented shortly after after
the invention of vulcanized rubber in 1839 by Charles Goodyear. The homemade
weapons were then notoriously used by young vandals. Then, in the hands of a
skilled hunter, could be used on medium sized game from short ranges. They were
primarily made with a Y-shaped wooden frame with two elastic rubber bands
connected to the uppers tips of the frame. The next big innovation of the
slingshot was the Wrist-Rocket, developed by a company later named Trumark. It is made with bent aluminum rods instead of
wood, and creates a wrist brace to help counter the torque created by the
bands. The most powerful shot ever recorded had an energy
of 135 joules, caused by the increased draw distance of the
"starship" slingshot.
Research Aim: In my experiment I want to test the
relationship of the draw distance of a wrist rocket slingshot to a small
plastic pellets velocity. I also want to be able to compare the results of my
experiment to the spring constant. I want to see if Hooke's law can be
implemented to slingshots.
Hypothesis: As the draw distance(cm)
increases, the exit horizontal velocity (m/s) will increase linearly, proving
that Hooke's law is a viable method in measuring a springs energy. I have this
hypothesis because of the law of conservation of energy. It states that no
energy can be created or destroyed, only transferred to different things. I
think the amount of energy that the ball transfers will be a miniscule amount.
- The independent variable is
the draw distance of the slingshot measured in centimeters. The interval
between two points will be 2.5 centimeters.
- The dependent variable is the
velocity of the ball, measured in meters per second.
- Controlled variables include:
the slingshot, the ball, and the person releasing the slingshot(me).
These must remain constant to insure there are no faults in the data.
- Slingshot
- 1g Plastic ball
- Masking tape
- Meter stick
- Carbon paper
- Two sheets of printer paper
- Sharpie
- Safety goggles
Safety Concerns: Unfortunately, when working with
flying projectiles there is always a possibility that somebody could get hit in
the eye and be severely injured. For this reason, all spectators and I had to
be wearing safety goggles during the trials.
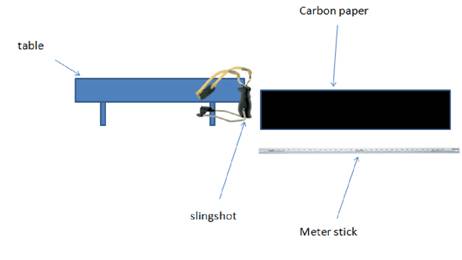
1. Find a place with a large
launch of 20+ meters in order to insure that the projectile never is brought to
a halt by something in the environment.
2. Tape the wrist rocket
slingshot on the top edge of a .75 meter tall counter, so that the elastic part
of the slingshot is lying flat against the counter.
3. With the sheets of paper,
align them behind the slingshot; then, with the slingshot being laid with the
elastic taken backwards as far as it can go without any force being applied to
pull it back, mark every 2.5 centimeters with the sharpie directly behind the
leather pad. These marks will be used as reference to see how far back the
slingshot should be drawn during a trial.
4. Place a piece of tape on the
ground marking every one meter and write down on the masking tape the amount of
meters that it is distanced from the counter.
5. Place the carbon paper down
in order to track where the ball lands after each launch.
6. Now, begin with the first
launch of 2.5 centimeters. Place the ball into the leather pad and slowly pull
back to the 2.5 tick mark made in step 3. Let go of ball and measure the
distance that is travelled.
7. Repeat step 4 more times in
order to obtain a large sample size.
8. Do steps 6-7 again with each
tick mark going up to 22.5 cm.
|
draw distance |
trial 1 |
trial 2 |
trial 3 |
trial 4 |
trial 5 |
average |
error(±) |
|
2.5 |
73.66 |
77.47 |
88.9 |
91.44 |
66.04 |
79.502 |
12.7 |
|
5 |
243.84 |
231.14 |
264.16 |
241.3 |
233.68 |
242.824 |
16.51 |
|
7.5 |
424.18 |
388.62 |
408.94 |
416.56 |
396.24 |
406.908 |
17.78 |
|
10 |
497.84 |
469.9 |
518.16 |
520.7 |
441.96 |
489.712 |
39.37 |
|
12.5 |
574.04 |
622.3 |
645.16 |
609.6 |
662.94 |
622.808 |
44.45 |
|
15 |
777.24 |
751.84 |
723.9 |
792.48 |
708.66 |
750.824 |
41.91 |
|
17.5 |
878.84 |
914.4 |
830.58 |
838.2 |
861.06 |
864.616 |
41.91 |
|
20 |
985.52 |
952.5 |
980.44 |
1016 |
1000.76 |
987.044 |
31.75 |
|
22.5 |
1071.88 |
1150.62 |
1043.94 |
1168.4 |
1092.2 |
1105.408 |
62.23 |
Before we can derive any conclusions from this data, we need
to assume some things to make the experiment possible. First, we must ignore
all air friction and ball spin. This, in turn, will cause every launch to have the same travel time.
This can be assumed because of the constant acceleration of gravity being
forced onto the ball. The acceleration of gravity is -9.81m/s/s, meaning that
every second the ball speed downward will increase by -9.81m/s. Using the
formula s=ut+(1/2)at^2 after converting all the data
to meters, we find that of every launch is .28467 seconds. Another assumption
is that there is no negative horizontal acceleration enacted on the ball. This
is so we can assume the exit velocity is the same as the end velocity.
Here is a table of the data after being converted to meters:
|
draw distance |
trial 1 |
trial 2 |
trial 3 |
trial 4 |
trial 5 |
average |
error(±) |
|
2.5 |
0.7366 |
0.7747 |
0.889 |
0.9144 |
0.6604 |
0.79502 |
0.127 |
|
5 |
2.4384 |
2.3114 |
2.6416 |
2.413 |
2.3368 |
2.42824 |
0.1651 |
|
7.5 |
4.2418 |
3.8862 |
4.0894 |
4.1656 |
3.9624 |
4.06908 |
0.1778 |
|
10 |
4.9784 |
4.699 |
5.1816 |
5.207 |
4.4196 |
4.89712 |
0.3937 |
|
12.5 |
5.7404 |
6.223 |
6.4516 |
6.096 |
6.6294 |
6.22808 |
0.4445 |
|
15 |
7.7724 |
7.5184 |
7.239 |
7.9248 |
7.0866 |
7.50824 |
0.4191 |
|
17.5 |
8.7884 |
9.144 |
8.3058 |
8.382 |
8.6106 |
8.64616 |
0.4191 |
|
20 |
9.8552 |
9.525 |
9.8044 |
10.16 |
10.0076 |
9.87044 |
0.3175 |
|
22.5 |
10.7188 |
11.5062 |
10.4394 |
11.684 |
10.922 |
11.05408 |
0.6223 |
After gathering this data we had to calculate the horizontal
velocity using the equation s=ut+(1/2)at^2.
We can do these because we have already assumed that there is no negative
acceleration of the ball after its initial exit velocity. Therefore, the equation
can be reduced to: s=ut because when "a" is
0, that term cancels out. After doing this equation, I was left with this:
|
draw distance (cm) |
velocity(m/s) |
|
2.5 |
2.033138331 |
|
5 |
6.209841038 |
|
7.5 |
10.40603069 |
|
10 |
12.52361247 |
|
12.5 |
15.92733287 |
|
15 |
19.20114028 |
|
17.5 |
22.11119131 |
|
20 |
25.24209443 |
|
22.5 |
28.26906715 |
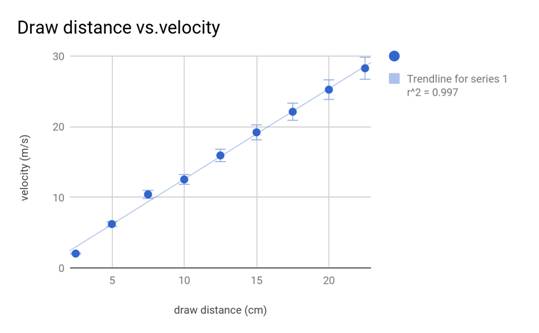
As seen in the graph the relationship
between draw distance and velocity is fairly almost perfectly linear. The
r^2-stat is 99.7% which means that the data is almost a perfect for the line of
best fit. The slope of the trend line is approximately 1.36, meaning that the
velocity increases by 1.36 for every centimeter, or 1/100 of a meter. This
proves that the spring constant can easily be applied to a slingshot. Because
the mass of the ball is constant, we know the the
force needed to pull back the slingshot is directly proportional to its
displacement.
Error 1:
The first error I noticed was that
the release of the ball was not always consistent. Because I was just using my
hands to steady the slingshot, the increased resistance from the elastic caused
my arm to tremble. When every trial is plotted on the same graph, it is clear
how this could have affected results. The dots, representing the
distance traveled in respect to draw distance, can be seen to spread farther
and farther apart the more I pulled back the slingshot.
The dots, representing the
distance traveled in respect to draw distance, can be seen to spread farther
and farther apart the more I pulled back the slingshot.
Solution 1:
The way I would go about fixing this error is to construct a contraption that
could launch the ballon its own. Somehow I would need
to ensure that the ball stayed within the confines of the leather pad, so the
landing was consistent. While it would be a difficult task, I think it would be
necessary if one were to repeat my experiment.
Error 2: Too
many assumptions. Of course this experiment would line up almost perfectly with
an ideal constant. Because my experiment did was without real-world things that
restrict motion.
Solution 2:
I think the best option to fix this error is to use a chronograph. This would
measure each launch projectile separately without need for any assumptions.
The
experiment suggests that the draw distance of a slingshot and the velocity of
the projectile it is launching is directly
proportional. This means that pulling the slingshot back from 0-10 cm will have
the same increase in velocity as pulling it from 15-25cm. So, next time I want
to hit stuff with slingshot, I know that there is no loss of energy if I pull
it back as far as I can. I'm curious to see where this relationship can be
found.
The range of
the data found was 26.24m/s which is really fast for only
extending the slingshot 22.5 centimeters. The fastest projectile went at a
velocity of 28.27 m/s. To put that into perspective, there are airsoft guns that shoot close to 15 m/s. Launching
a ball extended 22.5 cm on a slingshot goes almost twice as fast as that. I
would not want to be on the other end of one of those.
“Equations
of Motion.”
Wikipedia, Wikimedia Foundation, 13
Nov. 2017,
en.wikipedia.org/wiki/Equations_of_motion#Constant_translational_acceleration_in_a_straight_line.
“Slingshot
Physics.”
Real World Physics Problems,
www.real-world-physics-problems.com/slingshot-physics.html.
“Slingshot.” Wikipedia,
Wikimedia Foundation, 20 Nov. 2017, en.wikipedia.org/wiki/Slingshot.
“Summary
of Equations.”
Sentynel, sentynel.com/media/old/equations.html.
https://en.wikipedia.org/wiki/Slingshot
- A simple description of the tools used to analyze this problem
https://www.youtube.com/watch?v=XW9xhi_Qd9U
- A description of how to measure the draw distance of a slingshot
https://www.youtube.com/watch?v=xrb1Q_BcCdI
- An example of a long range slingshot shot
https://arxiv.org/ftp/arxiv/papers/1604/1604.00049.pdf
- Other physicists attempting to model the launch velocity vs
draw distance of a slingshot
http://www.thechalkface.net/resources/deriving_suvat_equations.pdf
- How to derive the equations used in this paper