The Distance that Water Jets Travel
from a Container
Cory Peters
Table of Contents
Pressure is a measure that defines
the force an object exerts over an area. The SI unit of pressure is the Pascal,
which is equivalent to 1 Newton per square meter of area. Pressure is present
everywhere in the form of the atmospheric pressure, equivalent to around
101,325 Pascals of pressure, conveniently called 1 atmosphere of pressure. This
is caused because there is around 100 km of atmosphere, which weighs down on
the surface of the Earth. Pressure caused by a fluid which presses down on a
surface is known as hydrostatic pressure. Hydrostatic pressure can also be
observed in water, such as at the bottom of the Marianas Trench, where
hydrostatic pressure creates pressures of around 110,000,000 Pascals.
Another such example of hydrostatic
pressure comes from leaks in containers of water. The hydrostatic pressure
exerts a force to the water escaping from a container of water, causing it to
spill out the sides at a horizontal velocity, rather than falling down the sides.
This results in the spills going out some horizontal distance from the
container due to the distance from the ground giving the water both time to
fall and an initial horizontal velocity. One would expect that the ideal ideal
distance that the water would travel would come from a leak somewhere in the
middle of the container because a leak at the bottom would not give the water
enough time to fall and gain distance, and a leak at the top would not provide
enough pressure to gain enough distance. Therefore, one would suspect that a
container with a leak in the middle would cause a leak with the greatest
distance due to it equalizing the two opposing factors of the bottom giving
enough force, but not enough time, and the top giving enough time, but not enough
force. However, the leak would most likely be slightly more towards the top
because atmospheric pressure would also result in the water gaining horizontal
velocity, and is independent of the initial height, leading to a constant
horizontal force that is independent of height, negating part of the reason why
a leak at the top would be unideal. Additionally, Torricelli's Law states that
the velocity of a jet of water out of a can has a velocity of  where g is the acceleration due to gravity and
h is the height from the top of the container. Combining this with the fact
that the time it takes a projectile to fall from a height h is
where g is the acceleration due to gravity and
h is the height from the top of the container. Combining this with the fact
that the time it takes a projectile to fall from a height h is  ,
the result is that the total distance traveled is
,
the result is that the total distance traveled is  ,
which has a maximum when h is exactly half of hmax.
,
which has a maximum when h is exactly half of hmax.
The purpose of this investigation is
to measure the effect of changing the height of a hole in container of water
has on the distance of the resulting jet.
The distance traveled by the water
jets will be approximated by the equation where h is the height from the bottom of the
container of the hole, which means a general curve which peaks at the point 10
cm in height and 20 cm in distance.
● Empty 2L bottle of soda - used as
the container that water will be shot from.
● Drill - used to make uniform holes
in the bottle
● Ruler - used to measure the
appropriate heights of the holes
● Caliper - used to measure the
distance of the water jets to a high degree of accuracy
● Ruler - used to measure the distance
of the height of the water and the holes on the bottle
● Watering can - used to refill the
bottle to the same water level between experiments
● Paper - placed beneath the bottle to
have a spot to jot where the water strikes
● Marker - used to a) mark a fill line
on the bottle to ensure consistent water levels between tests b) mark where the
bottle is placed on the paper to measure the distance the jets travel c) make a
hole in the paper where the water jets land from each trial
● Tape - used to cover the holes in
the bottle when not in use
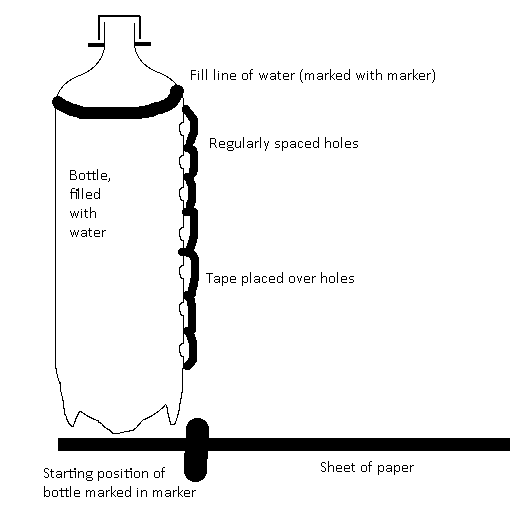
To begin the experiment, a line 20
cm above the bottom of the bottle was drawn in with the marker using the ruler
to measure the 20 cm distance. Then, holes were drilled into the bottle at
regularly spaced intervals, using the ruler to ensure that they are the correct
distance apart and the drill to create the holes into the bottle. Additionally,
how high each of the holes were from the bottom of the bottle was measured and
recorded for later use. Then, tape was placed over each of the holes to make
sure water doesn’t spill from the bottle while filling up with water. In the
next step, the bottle was filled up to the earlier demarcated 20cm fill line.
In addition, a watering can was filled up to refill the 2 liter bottle with
water in between experiments in order to guarantee that the amount of water was
consistent between trials. A long piece of paper was placed beneath the bottle
to give a surface to mark how far each water jet traveled. In addition to the
piece of paper, a line was drawn from the start of the bottle on the paper to
more easily measure the distance traveled by the water in later steps. For each
hole, the piece of tape covering it was removed, the location where the water
stream landed marked on the piece of paper with the marker, the tape reapplied,
the bottle refilled to the 20 cm line using the watering can and then the
bottle was shifted over and this process was repeated to create 5 data points
per hole. After marking these 5 data points, the calipers were used to measure
the distance between the line where the bottle started and the marked hole. The
tape was then reapplied to the hole, a new sheet of paper was placed under the
bottle, and the process of data collection was repeated using a different hole.
|
|
Height of hole above bottom (cm) |
Distance of Water (cm) |
Expected Distance (cm) |
|
Hole 1 |
0 |
5.33±.368 |
0 |
|
Hole 2 |
2.5±.05 |
15.82±.445 |
13.23±0.151 |
|
Hole 3 |
5.0±.05 |
17.76±.584 |
17.32±.115 |
|
Hole 4 |
7.5±.05 |
17.96±.445 |
19.36±.103 |
|
Hole 5 |
10.0±.05 |
16.70±.699 |
20.0±.100 |
|
Hole 6 |
12.5±.05 |
15.86±.203 |
19.36±.103 |
|
Hole 7 |
15.0±.05 |
15.36±.406 |
17.32±.115 |
|
Hole 8 |
17.5±.05 |
7.69±.165 |
13.23±0.151 |
Table of
the results
Remarks:
With the exception of hole 2 and
hole 3, all the observed data points traveled a shorter distance than the
distance predicted by the model due to Torricelli’s law (
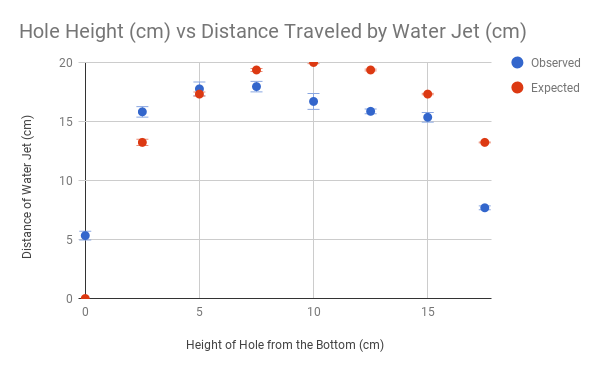
One of the things predicted by the
mathematical model is that there will be a peak value at a height that is 10cm
with a distance of 20cm. In the observed data, the peak value is located at 7.5
cm up the bottle with a distance of 17.96cm. The factors influencing the
distance to be shorter than predicted were earlier discussed. In addition, the
graph of the observed data appears to peak sooner than the mathematical
formula. After the peak on the graph, all the data is decreasing, which happens
at the 7.5cm mark instead of the 10cm mark. There are several potential reasons
for this discrepancy such as the air resistance having more time to take effect
at higher elevation holes, or the fact that higher heights are more greatly
influenced by the specific level filled to because the velocity is proportional
to the square root of the height above the hole, meaning that uncertainty in
the fill level will cause a larger uncertainty in the velocity of a hole higher
up than a lower hole. To more easily visualize this, a difference of 1 cm in
water fill will have a much larger effect on a hole that is 1.5 cm from the top
than one that is closer to the bottom.
Chart of
the percent errors
|
|
Height of hole above bottom (cm) |
Distance of Water (cm) |
Expected Distance (cm) |
Percent error (%) |
|
Hole 1 |
0 |
5.33±.368 |
0 |
N/A |
|
Hole 2 |
2.5±.05 |
15.82±.445 |
13.23±0.151 |
19.6 |
|
Hole 3 |
5.0±.05 |
17.76±.584 |
17.32±.115 |
2.56 |
|
Hole 4 |
7.5±.05 |
17.96±.445 |
19.36±.103 |
7.27 |
|
Hole 5 |
10.0±.05 |
16.70±.699 |
20.0±.100 |
16.5 |
|
Hole 6 |
12.5±.05 |
15.86±.203 |
19.36±.103 |
18.1 |
|
Hole 7 |
15.0±.05 |
15.36±.406 |
17.32±.115 |
11.3 |
|
Hole 8 |
17.5±.05 |
7.69±.165 |
13.23±0.151 |
41.9 |
There appears to be no blatant pattern to the percent errors
- they are neither all going up nor going down nor remaining constant - which
is indicative that the divergence between the expected and observed results was
most likely not due to systematic error but rather random error or an invalid
mathematical model. However, one piece that appears significant is that the
lower holes are more conforming to the model than the higher holes. For
instance, the two least percent errors present in the chart (2.56% and 7.27%)
occur in the lower half of the holes and the greatest error comes from the very
top hole (41.9%). This could represent that there were errors that were more
pronounced from the higher holes. For instance, there could be more time for
the air resistance to affect the higher holes, this slowing the water jets down
and causing this greater discrepancy between the mathematical predictions and
the observed data. In addition, some other potential sources of error are
enumerated below.
● Human error - placing the mark where
the 2 liter bottle is and marking where the water jets fall
● Non-consistent setup - the marker
used to indicate the 20cm fill line was thick and therefore the amount of water
placed into the bottle could be slightly different between trials due to
difficulty seeing the exact 20cm fill mark.
● Errors due to equipment - the
roundness of the hole also affected the distance that the water jet traveled.
For instance, while doing this experiment, the original hole 3 was drilled
improperly and could not properly create a water jet. What this demonstrated was
that the more circular the hole the longer the jets would travel and the less
circular the jets the less distance. Therefore, due to the difficulties in
cutting into plastic 2 liter bottles, there could have been error due to not
every hole being perfectly round.
● Different material - using a
different material would also holes to be properly drilled and thus avoiding
any errors caused by non uniform holes in the bottle
● A more consistent fill line - either
using a thinner marker or gathering all the water spilled between trials would
allow for more consistent water level between trials. Another option would be
to use an actual cylindrical container instead of one that tapers off at the
end like a 2 liter bottle does so that the container can be filled to the brim
between trials for a consistent fill line
Despite the data not following the
exact results predicted by the mathematical model, it still follows the general
trend of increasing rapidly until it peaks in the middle at around 20cm and
then slowly decreases, increasingly so towards the bottom. In addition, the
peak obtained in the data is only one hole away from the hole ½ of the way up,
which is one of the key predictions of the mathematical model, so the
hypothesis that the distance traveled by the water jets is
“About the Mariana Trench - DEEPSEA
CHALLENGE Expedition.” DEEPSEA CHALLENGE, National Geographic, 1 July 2014, www.deepseachallenge.com/the-expedition/mariana-trench.
The Editors of Encyclopædia
Britannica. “Atmospheric Pressure.” Encyclopædia Britannica, Encyclopædia
Britannica, Inc., 12 Jan. 2018, www.britannica.com/science/atmospheric-pressure.
Pielke, Roger A. “Atmosphere.”
Encyclopædia Britannica, Encyclopædia Britannica, Inc., 12 Jan. 2018, www.britannica.com/science/atmosphere.
https://en.wikipedia.org/wiki/Torricelli%27s_law - Statement and derivation of
Torricelli's theorem
https://en.wikipedia.org/wiki/Bernoulli%27s_principle - Principle from which Torricelli’s
theorem is derived
https://en.wikipedia.org/wiki/Hydrostatic_test - Example of the considerations taken in the real world as a result of the effect described in this paper
http://adl.stanford.edu/aa222/Lecture_Notes_files/chapter2_singlevar.pdf - Description of process used to
calculate the theoretical maximum of the distance of the jets
https://www.nottingham.ac.uk/nmp/sonet/rlos/bioproc/starlings/3.html - Description of the source of
pressure in this experiment