Research by: Mariana Ojeda
The Effect of Mass on Frequency
│ Introduction │ Problem │ Method │ Hypothesis │ Variables │ Apparatus │ Materials │ Procedure │ Data and Analysis │ Uncertainties │ Conclusion │ Possible Errors │ Works Cited | Return To Research |
To produce a certain note on the violin at the correct pitch, there are certain things that need to happen. The first step is to make sure the violin is in tune by using a device called a tuner that indicates whether the string is in the right pitch or not, one’s ear (preferably after having memorized what the strings are supposed to sound like), or metal forks called tuning forks that produce a certain pitch when they are hit at the ends. One adjusts their own strings to get the right pitch by turning the pegs and fine tuners that are connected to each string to either the left or right. The second step is to determine what note is wanted to be played. There are four strings on the violin which are G,D,A and E. G is the lowest string that can be played and E is the highest. If one wants to play an A on the A string, one can play it by just using the bow and playing the string without using any fingers. Although, if one wants to play that same note on the D string, one must place their fourth finger on the D string and then the sound is produced by using the bow.
This process represents the relationship between mass and tension creating pitch. This relationship is supported as the Department of Communication Disorders and Sciences from the University of California states, “On the other hand as the Tension of a vibrating body is increased, the frequency increases. This also is quite familiar to most of us who have plucked a guitar string while turning the screw to increase the tension of the string. The pitch rises as we turn the screw,” (Mass and Tension). One pressing their finger on the string to create a specific pitch is another example of tension that's increasing because the finger is making less space for the string to vibrate with. As one turns the pegs to tune the strings, the pitch is increasing or decreasing depending how out of tune the string is due to the tension the pegs are creating.
Furthermore, the Department of Communication Disorders and Sciences states, “...Any object that can vibrate is capable of creating a tone.” Therefore, strings that are not necessarily meant to be played as an instrument can create a pitch as long as there's tension.
The purpose of this investigation is to find out how tension created by mass affects the pitch (frequency) of a string.
I will use an apparatus that holds a piece of fishing line in a way that it will produce sound when plucked. The string will be suspended between a loop screw and a pulley in order for masses to be hung at the end of the apparatus. This will be further explained with the rest of the materials.
If I increase the mass pulling on the string in intervals of 200 grams then its pitch will increase at a constant rate because of the constant rate the tension is being changed at.
Independent: Mass in grams (g)
Dependent: Frequency in hertz (hz)
Controlled:
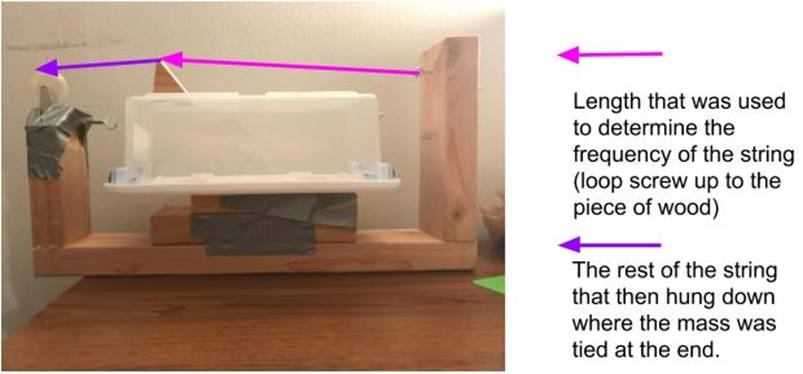
● Length of string that will be used to pluck from loop hook to the top of the piece of wood. The same length will be used to capture its frequency.
● Type of string- the same fishing line (with the same weight) will be used to measure its frequency.
● Area of data collection- I collected the data at my living room where the pitch would be recorded.
● App- I used the same app called n-Track Tuner to measure the frequency of the string.
● Plastic container- This was used to better amplify the frequency of the string so the app can detect it.
● Method of collecting the data for each trial- For every mass, I measured its frequency five times by plucking the string then putting my finger on it so the pitch doesn’t last long.
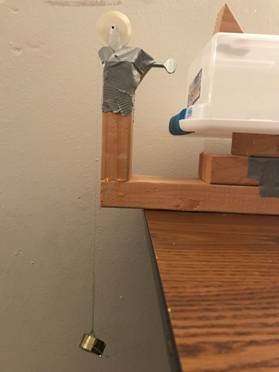
● Apparatus-made of four pieces of 0.0381 m by 0.0889 m wood (pictured above), loop hook, and pulley
● Plastic box
● Fishing line
● Set of weights
● App- n-Track Tuner
1. I first measured what the length of the string would be from the loop screw to the piece of wood. This resulted to be .34 meters.
2. I then tied the 200g weight at the end of the string and then let it hang.
3. I then used the n-Track Tuner app to measure and record the frequency of the string as I plucked it.
4. I continued to pluck it for four more times continuously (a total of five). Every time I plucked it, I would then put my finger on it to stop the frequency from ringing for a longer amount of time so I could continue to pluck it again for the next trial.
5. After the five trials, I would tie more weight at the end of the string, 400 grams and would repeat steps 3 and 4.
6. The rest of the weight measurements I would use to measure the string’s frequency were 600, 800, and 1000 grams. I repeated steps 3 and 4 for these weight measurements.
Table 1- Mass weighting the string down (g) and its five trials of frequency (hz)
|
|
Trials in (hz) |
|
|
|
|
|
Mass in (g) |
Trial 1 |
Trial 2 |
Trial 3 |
Trial 4 |
Trial 5 |
|
200 |
187.0 |
186.3 |
186.5 |
186.6 |
186.3 |
|
400 |
210.7 |
210.6 |
209.8 |
210.0 |
210.2 |
|
600 |
307.6 |
307.5 |
307.3 |
307.1 |
307.3 |
|
800 |
318.9 |
318.1 |
318.0 |
301.0 |
317.7 |
|
1000 |
338.1 |
337.9 |
336.3 |
336.6 |
334.9 |
From the raw data, I took the trial data for each mass and calculated the average frequency. The results were then recorded on table 2.
Table 2-Mass that was tied to the end of the string and its average frequency
|
Mass in grams |
Average Frequency in Hz |
|
200 |
186.5 |
|
400 |
210.26 |
|
600 |
307.36 |
|
800 |
314.74 |
|
1000 |
336.76 |
I then graphed Table 2 as shown:
Graph 1
Data: Check
Table 2 above
By looking at this graph, I have noticed that the frequency of the fishing line doesn’t increase at a constant rate. To see how exactly the frequency is changing between the masses (the speed), I will use the formula v= √ (F/(m/L)) as described by the websites HyperPhysics and Natural and Behavioral Sciences. F is the tension of the string (Chapter 16), m is the mass of the string (Standing Waves on a String), and L is the length of the string that the frequency traveled through. Therefore, F is 9.81 N/Kg multiplied by the mass that was hung by the string. L is 0.34 meters as described in step one of my procedure.*The variable m is 0.000072 kilograms.
*To figure out the mass of the plucked string, I weighed a measured piece of the fishing line to then calculate how much .34 meters of it weighed in kilograms. The weighed piece was 18.75 cm ( converted to 0.1875 m) and its mass was 0.03 g (converted to 0.00003 kg). I used the ratio 0.1875/0.00003=0.45/m to find the mass of string that was plucked. The solution to m turned out to be 0.000072 kg.
The following is the table and graph of what I got for wave velocity for the five masses when I plugged them (the average frequencies from table 2) into the equation v= √ (F/(m/L)).
Table 3- Mass in grams and Wave velocity
|
Mass in grams |
Wave Velocity in m/s |
|
200 |
3501.785259 |
|
400 |
4952.272206 |
|
600 |
6065.269986 |
|
800 |
7003.570518 |
|
1000 |
7830.229882 |
Graph 2
Data:
Check table 3 above
This graph (2) supports the results in graph 1 because it shows that the wave velocity is increasing but not at a constant (linear) rate. By looking at its line of best fit, it can be seen that the velocity is increasing at a quadratic rate (I chose the line to be a polynomial because the data seemed resemble a polynomial line). This has an effect on the frequency since it’s a variable that determines its wave velocity as shown in the formula v=fλ (where v is the velocity, f is the frequency, and λ is the wavelength, according to The Physics Classroom). *
*(Side note) Because the polynomial is in the second degree and it’s negative, it can be concluded that the wave velocity will eventually hit a peak at its maximum velocity and then it would start to decrease.
Mass of string ±.005 g - I measured it in grams. I got the uncertainty by dividing the lowest possible division by 2.
Frequencies (the 5 trials)- 200 grams- 186.5± 0.35 hz, 400 grams- 210.26± 0.45 hz, 600 grams- 307.36± 0.25 hz, 800 grams- 314.74± 8.95 hz, 1000 grams- 336.76± 1.60 hz
This is the average plus or minus the range divided by 2 according to TuHs Physics.
After this experiment, I found out that I was correct that the frequency was going to increase as the mass was added to the end of the fishing line. Although, I was wrong that the frequency was going to increase at a constant rate. By using the formula
v= √ (F/(m/L)), I was able to figure out how the wave speed was responsible for line’s appearance in graph 1. The line of best fit for the data that came out of the formula suggested that the velocity was increasing at a quadratic rate.
● String measurement-I didn't measure the length of the string that was being plucked before data collection for each mass. This error can have an impact on the overall experiment because the length of the string is used to determine the velocity of the frequency.
● App- Another possible error is that the app I used to capture the string’s frequency was not accurate, increasing the difference of frequencies between the masses. This supported by the uncertainties in masses 800g and 1000g.
● Swinging of mass affecting its frequency- Because the masses were hanging from a string, it had an ability to keep on swinging while I was measuring the frequency. This is possible I didn’t always make sure to see if the mass was not swinging. The swinging mass can have some effect on frequency because the mass would be affected by horizontal force in addition to the vertical force that was already being accounted for.
● Environment- I chose to test the frequency of the string in my living room. Although I did this experiment while there weren’t any obvious sounds present (like music or the television playing out loud), it is possible for the sounds from other rooms and outside to go through the walls and affect the app’s data collection.
● Data- I only did 5 trials and 5 variations of masses, limiting the amount of data to be analyzed. I could have gone further by adding more mass variations to further support my conclusion.
“Chapter 16.” Natural and
Behavioral Sciences, Pellissippi State Community
College, www.pstcc.edu/nbs/WebPhysics/Chapter016.htm.
I used this website because it went in depth about how to derive formulas to calculate waves with.
Murray,
Chris. “IB Uncertainty Worksheet.” TuHSPhysics, https://sites.google.com/a/ttsd.k12.or.us/tuhsphysics/home/htp-ib-physics/linear-kinematics/ib-uncertainty-worksheet.
This page served as a refresher on calculating uncertainties.
DEPARTMENT
OF COMMUNICATION DISRDERS AND SCIENCES College of Health and Human Development
California State University, Northridge. “Mass and Tension.” As the Mass of a Vibrating Body
Increases, Its Frequency Decreases, but as the Tension Increases the Frequency
Also Increases., www.csun.edu/~vcoao0el/webct/de361s71_folder/tsld004.html.
It explained how mass and tension worked together to create pitch. It also gave real world example to better understand the concept.
Nave, Carl R. “Standing Waves on a String.” HyperPhysics, C.R. Nave, http://hyperphysics.phy-astr.gsu.edu/hbase/Waves/string.html.
It gave another variation on how to calculate for frequency of a string.
Nave, Carl R. “Wave Relationship.” HyperPhysics, C.R. Nave, http://hyperphysics.phy-astr.gsu.edu/hbase/wavrel.html#c1.
This had another variation of calculating for the velocity of the frequency.
“The Wave Equation.” The Physics
Classroom, The Physics Classroom, www.physicsclassroom.com/class/waves/Lesson-2/The-Wave-Equation.
It was another
explanation on how the wave equation worked.