Height of
Drop verses the Distance of the Splash: Introduction | Purpose | Methodology | Variables | Results & Analysis | Conclusion | External Links | Return to Research
Derek Pinto
Tualatin
High School
Henry Foster
Tualatin
High School
In the past of study hydrodynamics,
scientists have discovered certain characteristics that give water its unique
properties. One such study was conducted to determine if water, in a spherical
droplet form, would slide or roll across wax paper. The outcome- which was that
water rolls if allowed to- opened the idea that water can display
characteristics like that of a solid because of its surface tension. It
is this property of water that affects the way it behaves on surfaces and while
suspended in the air. Two areas where a water drop experiment would be affected
by this characteristic. As water contacts a surface with a certain speed and
mass, the only other variable that changes how it breaks apart from impact and
distributes is its surface tension.
Real-Life example
A real-life situation is which a logistic model helps us improve
with more precision and accuracy is strength training. Each person has their
inert strength that is established from genetics, for example the average man can
bench press 135 lbs. That individual can increase their potential by Bench
pressing more and more. Over time their capacity will grow at an increasing
rate because their muscles have a great amount potential to develop. Only, a
human being can only create so much force, which means that as their potential
reaches its max, so will the amount that the subject can lift. Obviously a man
can’t lift infinite pounds, such as the near exponential growth at the
beginning of their training suggests. As they reach their maximum, a principle
known as diminishing returns becomes prevalent; one has to work harder to
develop the same amount of increase in force than they did at lower poundage.
Logistic Characteristics
The strength building problem is an example of the logistic
model, specifically logistic growth. Logistic growth is a sort of “fusion”
between two types of growths. The first half of the function has exponential
growth, where the data starts relatively low
and slowly concaves upward until it is growing towards infinity, but the
second half of the logistic model is where the trend inflects and concaves downward as it still grows, known as
bounded exponential growth. The points in the bounded exponential growth grow
closer and closer to a horizontal limit above the data. One might think of it
as a ceiling that it will touch only once it reaches maximum potential. These
two growths combine to form our model for water’s velocity compared to its
force on impact.
In this experiment, my partner and I will consider the logistic
trend of velocity in its translation to force in a drop of water. Before this
experiment, we assumed that there would be a horizontal limit that the drops
could reach at terminal velocity, where no matter how far we drop it from, the velocity will reach the same speed thus creating
the same amount of force. We would focus on the maximum distance travelled by
the water particles because that tells us how far it’s possible for the water
to travel. In order to create a more accurate field of data, we will collect
four clear data points in each trial, using maximums found in each cardinal
direction.
Water properties
Drops of water have two primary elements in physics. The first is
adhesion or its ability to stick to another surface, and the second one which
will more directly affect this experiment: cohesion. This characteristic
affects how well the particles of the drop will be able to stick to one
another. The cohesion combined with an outside force creates surface tension,
which is the water’s ability to “stick” together when force is being applied to
its surface. Water at about 20oC has 72.8 dyne/cm or 7.28x10⁻⁴ N/cm.
This is relevant to the investigation because in order to cause the water to
splatter it needs to have enough force to break that and propel the particles
away from each other.
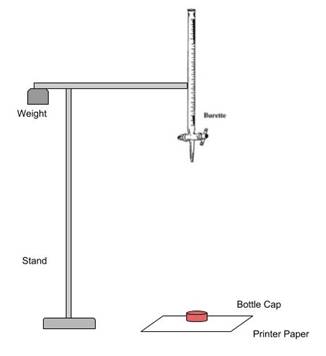
Burette:
There were a variety of different ways
to drop the water onto the paper. The first way was to use a pipette. It would
be good to drop a single drop of water onto the paper, but we later realized we
wanted to drop multiple drops onto the same target. This took us to the
burette. The burette would be able to drop similar sized drops at a constant
rate. The burette would also be able to be attached to a stand so that it can
drop the multiple drops on the same exact place.
Stand and Drop Height:
Some sort of stand was required to attach the burette to hold it
in place. We used supplies that we already had to assemble a stable stand. It
couldn’t be too tall because then after touching it, the stand will keep
swaying for too long which could have tainted our data. So with the burette
attached to the stand, the water could only have been dropped from a max height
of 93cm. With that said, we decided to test the drop at a height of 90cm, 80cm,
70cm, 60cm, and 50cm.
Particle distance travelled:
At the beginning of each trial, we
established a centre by dropping one drop onto the printer paper. After that we
placed the elevated surface on that point and circled around it in pen. After
completing the next ten drops onto the paper, we would use a meter stick to
measure the 4 maximums on the paper.
Experiment Design
The purpose of this investigation is to study how the height of a raindrop
affects the distance that the water splatters after impact. We do three trials at 5 different heights. The water is dropped
onto a small lifted platform [in this case a small bottle cap (height: .9cm
diameter: 3cm)]. The water would drip onto the cap and splash onto printer
paper, which made it be easier to see where the water landed. To eliminate some
error, we would measure the furthest distance from the center of the impact
point from different directions and average them and record the data.
The independent variable is the height at which the water
is dropped at for 3 trials, and then the height is raised each time by 10cm.
Another independent variable is the rate at which the drops of water are
falling. This variable is not measured and therefore varied each time. While no
effect on the experiment by this variable was noticed it still wasn’t
controlled each time.
The dependent variable is the distance that the water particle travels
after hitting the cap. This variable is changed because we have a target to
hit, and it is impossible to manually hit the target in the same spot of 150
drops in a row.
The controlled variables include the Burette which is used each time in
this experiment, the size of each water drop, and the cap at which the drop is
initially hitting.
Assumptions
We assume that our graph will follow a logistic growth
model. This is because when the water gets dropped at a low height, the
splatter distance will only increase at an exponential rate. Eventually, the
water will start getting dropped higher and higher and eventually reach
terminal velocity, which will decrease the slope on the graph.
In our calculations, we assume that there is no air friction from when the
water leaves the burette to when in lands on the printer paper. It is also
assumed that all of the drops are the exact same size and weight and all of the
drops are dropped at the same rate.
An assumption in our equation and model is that all particles that travel from
the drop site are equal to each other. That is to say that each part of the
drop is 1/x of the original drop. We know this is isn’t completely accurate
because nature tends toward entropy and increasing the impact force will in
turn increase the entropy of the form of water particles.
The average of each trial was calculated by: ((d1 + d2
+ d3 + d4)/4) = dx
FIGURE 1: This table of the raw shows the height at which ten
drops fell from, which trial was being recorded, and the four maximums of each
trial. The rightmost column is the most important as it shows the average
maximum distance covered by the drops which will help us create a model and
illustrate the model of water falling.
|
Height |
Trial |
Drop 1 |
Drop 2 |
Drop 3 |
Drop 4 |
Average |
|
90 |
1 |
31.3 |
26.2 |
25.8 |
29.6 |
28.2 |
|
90 |
2 |
33.4 |
30.6 |
24.3 |
32.4 |
30.2 |
|
90 |
3 |
32.6 |
35.4 |
33.0 |
29.4 |
32.6 |
|
80 |
1 |
23.9 |
25.1 |
23.9 |
21.7 |
23.7 |
|
80 |
2 |
24.2 |
25.5 |
24.3 |
28.6 |
25.7 |
|
80 |
3 |
18.6 |
24.4 |
27.7 |
21.4 |
23.0 |
|
70 |
1 |
14.0 |
24.2 |
18.8 |
19.9 |
19.2 |
|
70 |
2 |
19.8 |
22.2 |
17.7 |
22.3 |
20.5 |
|
70 |
3 |
18.6 |
22.9 |
23.0 |
17.0 |
20.4 |
|
60 |
1 |
18.4 |
18.4 |
18.3 |
18.7 |
18.5 |
|
60 |
2 |
18.8 |
21.3 |
19.2 |
16.3 |
18.9 |
|
60 |
3 |
20.0 |
19.8 |
18.2 |
20.1 |
19.5 |
|
50 |
1 |
20.5 |
16.4 |
16.9 |
17.4 |
17.8 |
|
50 |
2 |
17.3 |
17.7 |
18.4 |
15.9 |
17.3 |
|
50 |
3 |
19.4 |
18.6 |
17.6 |
20.2 |
18.9 |
Graph & explanation
In the graph above, the data in all three trials are shown. They all follow the
same trend which shows how they all are somewhat accurate. The graph shows that
as the height from where the water drops increases, the distance of the splash
increases as well, but at an exponential rate.
Equation
![]()
· e = 2.72
· x0 = terminal velocity
· L = the curve's maximum value
· k = the steepness of the curve
In order to find k we must first know the maximum distance travelled
possible, which can be found using an equation that relates terminal velocity
to distance. To find that distance we have to convert how much force the
velocity exerts on the water drop and how that affects it to “split into
particles” which will allow us to calculate the horizontal and vertical
velocities that the particles have after bouncing off the ground.
Analysis of Data
Our experiment shows that as the height of the drop increases, the splash
distance also increases at an increasing rate. At first glance it looks like
our graph is only increasing exponentially because we never reached terminal
velocity. If we were able to keep raising the height and be able to have it
high enough for the drop to reach terminal velocity, then our graph would look
similar to logistic growth.
Uncertainty
Our uncertainty calculated was by taking the average of the range
of maximums collected in each trial, i.e. (d1 - d2)/2.
Our uncertainties correlated well with the data for two reasons.
The first is that as we dropped the water from greater heights, there was more
error for the same amount of precision at a lower height. An example would be
the resonance of the stand through the burette, which is amplified by the
longer it is. This is confirmed by the uncertainties being larger as the
heights increased.
The second reason our uncertainties were consistent with our model
is that with a greater height, there will be a greater maximum distance
possible. This means that on a scale there are more possible points to be
possible. Imagine there are two sets of numbers, [0,50]
and [0,100]. The second set has a greater maximum and a greater amount of
points than the first. That is the same situation as the data collected in our
experiment.
The Logistic Model. The experiments results yield a promising
trend of the logistic model. The horizontal start of the graph correlates with
the slope of distance equal to velocity which is equal to the model at2+bt+c. The end behavior of the model also conforms to the
theory that as the water drops approach terminal velocity, the distance the
particles travel will reach their limit as well.
Results. Results would not be as achievable without the burette. Its
functionality to dispense a series of drops in the same location were ideal for this experiment. The results that were found
indicate that the relationship between velocity of water falling and
the kinetic energy that break apart and propel the water particles
away from the centre point is complex and changes depending on the extremes of
the variables.
Limitations. A limitation in
this experiment is that the stand for the burette was too short which prevented
us from reaching terminal velocity. Another limitation is that after touching
the burette to drop the water, the stand would sometimes shake and would
slightly skew our data. We tried to prevent this from happening by holding a
bowl under the burette to catch all the water until the shaking would die down.
Most of the time the shaking would stop and there was no problem, but sometimes
it would still be relevant and it could have slightly skewed our data.
An important improvement to this design would be to limit all
precision error by having a fixed dispenser and centre point with a flat
surface for the water to impact. This would cause a more even and well spread
data field. It can be pointed out that eliminating these errors may change the
model of our data significantly.
External links
http://www.appstate.edu/~goodmanjm/rcoe/asuscienceed/background/waterdrops/waterdrops.html
- Background on properties of water, focuses on: cohesion, adhesion, and
surface tension
https://www.zmescience.com/science/news-science/why-water-drop-splash/
- Reasons and discoveries as to why drops splash in a specific pattern
https://www.youtube.com/watch?v=kvSr8IeAg4Q
– Video of water droplet impacting hard surface in slow motion
http://journals.ametsoc.org/doi/pdf/10.1175/1520-0469(1949)006%3C0243%3ATTVOFF%3E2.0.CO%3B2 – Report on water droplets terminal velocity of fall
https://water.usgs.gov/edu/raindropshape.html
- Shape of a raindrop vs. assumptions and why they are not true