Justin Atkins
Garrin Laird
Five grams with and without sail graph
Ten grams with and without sail graph
Fifteen grams with and without sail graph
Twenty grams with and without sail graph
Twenty-five grams with and without sail graph
Background
information:
A force is a push or pull upon an object resulting from the object's interaction with another object. Velocity is defined as a vector measurement of the rate and direction of motion. Velocity is a result of force but force is not a result of velocity. By using a level surface with a pulley at one end of it and an object attached by string to varying masses under the pulley, one can measure the velocity of the object, the terminal velocity, the acceleration, and the force placed upon the object. Air resistance describes the forces that are in opposition to the relative motion of an object as it passes through the air. As the velocity increases, the air friction will also increase because more air molecules strike the object as it increases velocity. Also, increased surface area of an object increases the amount of air friction because, once again, more air molecules are impacting the object. The values for the acceleration, velocity, terminal velocity, and force on the object are all impacted by air friction.
Statement of the
Problem:
The purpose of this investigation is to determine the relationship between force and velocity and the impact this relationship will have on an object with and without a sail attached to it.
Hypothesis:
We believe that increased force on an object with a sail will increase the velocity to a certain point where the object will meet its terminal velocity. This is because the object with a sail will continue to accelerate and therefore increase velocity until the air resistance will be too great as a result of velocity. At this point, the acceleration will no longer increase and the velocity will remain constant. The independent variables will be varying masses attached to the object as well as a sail and the dependent variables will be the velocity, terminal velocity, acceleration, and the amount of air friction.
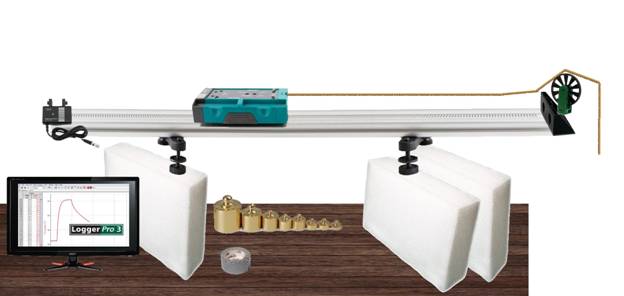
In order to begin testing, we placed a 1.2 meter long Vernier
Long Track near the edge of a countertop. Next, we placed an end stop at the
edge of the track closest to the end of the countertop and attached a pulley to
the top of it. Then, we placed a Vernier Motion
Encoder Receiver to the other end of the Long Track. After this, we attached a
1.4 meter long piece of string to both the Vernier
cart (aforementioned as the “object”) and the pulley. We then connected it to
the Logger Pro software. The experimentation was done by one group member
pressing “Collect” on the Logger Pro software and the other group member
releasing the cart and then allowing it to roll until it hit the end stop. The
Logger Pro software collected the time, position, velocity, and acceleration of
the cart for five seconds. We then copied and pasted the time, position,
velocity, and acceleration into a document. We repeated this for five sets with
five grams, 10 grams, 15 grams, 20 grams, and 25 grams for five trials then
repeated the same sets with the same masses but included a sail. In total we
did 10 sets and five trials in each set.
● Vernier Long Track
● Vernier Cart
● Vernier End Stop
● Vernier Ultra Pulley Attachment
● Vernier Motion Encoder Receiver
● Logger Pro Software
● 5,10, and 20 gram masses
● Duct Tape
● Styrofoam
● Computer
● Sail made of thin styrofoam paper (443.45 cm²)
● Styrofoam in order to lift the track
The results show that the cart never reached terminal velocity even with the
sail attached. Because we measured the velocity and acceleration with and
without the sail, we can determine the impact that the sail had on the cart
velocity and acceleration. On average, the highest velocity reached by the cart
without the sail was 17.86% faster than the highest velocity reached by the
cart with the sail for each corresponding mass. Furthermore, the cart
accelerated at a much slower rate with the sail than without the sail. This is
shown in every trial as the time to reach the end stop was always slower with
the sail than without the sail, and the peak velocity reached was always slower
with the sail than without the sail. All in all, results were reasonably
similar in all trials except the first trial of the 10 grams with a sail. This
trail was likely a result of error.
Five grams with and without sail Go Up
Data file: text without sail .:. text with sail .:. Excel
Ten
grams with and without sail Go
Up
Data
file: text without
sail .:.
text with sail .:. Excel
Fifteen
grams with and without sail Go Up
Data file: text without sail .:. text with sail .:. Excel
Twenty
grams with and without sail Go Up
Data file: text without sail .:. text with sail .:. Excel
Twenty-five
grams with and without sail Go Up
Data file: text without sail .:. text with sail .:. Excel
There are many sources of error that could have impacted our results. Firstly, the Vernier Motion Encoder Receiver was inaccurate at times. It displayed multiple trials traveling varying distances despite every trial being the exact same distance. Next, Justin had to complete three sets of data (15 grams, 20 grams, and 25 grams with the sail) without Garrin’s assistance. This could be a source of error because Justin was using a meter stick to set the cart in place in order to click the “collect” button on Logger Pro. While reaching for the mouse, he could have moved the cart slightly and this could have impacted results. Lastly, when the cart impacted the endstop, this caused the masses to swing side to side. We did not wait for the swinging to cease before continuing the next trial. This could have influenced results because momentum from the swinging could have caused variable acceleration as seen in the data sets of 5 grams and 10 grams without the sail.
In conclusion, the data did not support our hypothesis because we never reached terminal velocity in the first place. Although our hypothesis was incorrect, we did find a relationship between the amount of air friction present and the velocity and acceleration of the cart. The relationship shows that the more surface area an object has, the more air friction is present, and therefore the more velocity and acceleration is impacted. To further research this topic, it is important to minimize error and insure that terminal velocity. In order to meet these demands, it would be important to invest in a new Motion Encoder Receiver, a longer Vernier Track so the cart has a longer time to reach terminal velocity, a sail that is larger in area in order to increase air friction against the cart, and ensure that the masses stayed still before conducting further trials or sets.
www.thoughtco.com/velocity-definition-in-physics-2699021
Used in order to define velocity and find real world applications of velocity
www.physicsclassroom.com/class/newtlaws/Lesson-2/The-Meaning-of-Force
Used to define force and the Newton. Explains vector quantities well.
www.universetoday.com/73315/what-is-air-resistance/
Tells what air resistance is, what impacts it, and how to calculate it.
https://www.youtube.com/watch?v=dxcx35x5L9Y
Air resistance simple video explanation. It’s made for children but it’s still valuable.
https://www.grc.nasa.gov/www/k-12/airplane/falling.html
NASA explanation of air resistance and drag. It’s valuable because it offers a more complicated explanation as well as more accurate formulas.
https://www.youtube.com/watch?v=E-3EdtKicHg
Important video discussing the ethical dilemmas that come with air resistance
Jones, Andrew Zimmerman. “What Velocity Means and How To Calculate It.”ThoughtCo, www.thoughtco.com/velocity-definition-in-physics-2699021.
“The Meaning of Force.” The Physics Classroom, www.physicsclassroom.com/class/newtlaws/Lesson-2/The-Meaning-of-Force.
“What Is Air Resistance?” Universe Today, 17 May 2016, www.universetoday.com/73315/what-is-air-resistance/.