What effect does percentage of white noise coupled with clear tone have on human’s abilities to pinpoint sound?
By Layton Webber
Background Top
Humans are able to use a combination of time difference between the two ears and information from one ear in order to help locate the position that a sound is originating from (Zyga). The main tool for determining where different sounds come from is the pressure difference from the sound waves interacting with both of human’s ears in different ways. This means that sound waves compress the medium they are traveling through, and these compressions can then in turn be picked up and give people the ability to hear, and not only hear but also pinpoint locations that sound is emanating from which can help locate sources of danger (Hall and Patillo). Everyday people interact with noises of different frequencies and powers which in turn leads to the rise of different physical properties that can be studied and used. A common analysis of sounds that can be performed to gain information is determining the spectral density of different sounds waves.
The spectral density is a measure of strength of a signal at a particular frequency in comparison to all other frequencies (WaveMetrics, Inc.). This allows for an analysis of different signals to contain information about where the majority of the energy contained in the wave is located, and which in turn can give rise to some information of sound waves. Ordinarily, a sound is produced and then analyzed with methods such as Fourier Transforms to determine the general spectral density of a sound wave for any given experiment. For example, in analyzing heart beats where the strength of the sound wave produced by the contraction of heart muscles (Schilndwein). This would be a case of where spectral density is analyzed after the fact to gain information; however, specific spectral densities can also be produced using test tone software on a computer if, as is the case with this experiment, the densities themselves are the things of interest and how they affect humans abilities to pinpoint sound.
Tying back into spectral density now by using the varied frequencies of different produced sound waves different pressures can be generated to be tested. For example, white noise contains equal energy at all frequencies, while something like a clear note will contain high strength at a single frequency (Foley). So if different patterns of pressure are produced it may follow that the human ear is more capable of locating the source of a noise depending on how the pressure varies.
Statement of Problem Top
The purpose of this investigation is to determine the effect that an overlaid frequency has on the ability of people to pinpoint the source of that sound accurately.
Variables Top
Independent Variable: Overlaid frequency, this is the frequency that is being produced in addition to the white noise.
Dependent Variable: Distance between pinpointed location and actual location in radians, this will be a measure between the point of the laser pointer and the actual source of the sound
Hypothesis Top
If the overlaid frequency is put over a white noise and ranged from 250, 500, 1000, 2000, to 4000, then the ability of people to locate that source of noise will also decrease from approximately 20 cm accuracy down to 0 cm accuracy by steps of 5 cm correlating with the increase in frequency.
Materials Top
Blindfold, laser pointer, laptop, test tone generator, tape measure, spinning chair, tape
Safety Concerns Top
The main safety concern with this lab is the laser pointer, which could be damaging if shined directly in someone’s eye. To avoid this the tester should not look directly at the test subject when they have the laser pointer on. Other than this there is no danger from other parts of this lab, as no member of the experiment is exposed to high or low frequency noise for long enough to have an effect.
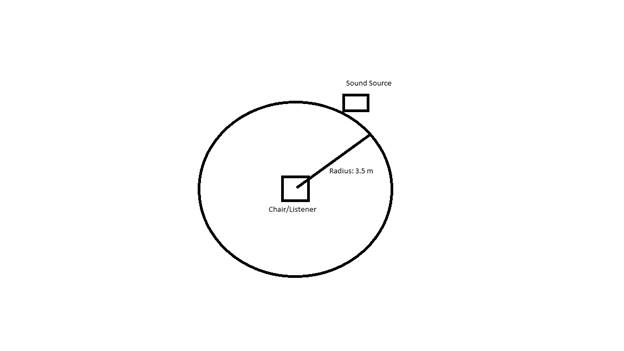
Diagram Top
Procedure Top
First, acquire a chair that can spin around like an office chair and put that in the center of a room. Then mark out a 2.5 radius circle around that chair and mark it so that the tester can walk around to different sections of the circle. Prepare the blindfold/spotter by taping a laser pointer in the on position on a blindfold so that the laser is pointing in the same direction that the subject is looking. Next, have the subject sit in the chair in the center of the circle. The tester will then take the tone generator to a random spot on the circle and set the right channel to 250 Hz and the left channel to white noise in the program. The person in the chair should then be spun around 4 times to ensure that they do not know which way they are facing in the room, and the tone is started. Give the subject 10 seconds to point their head in the direction they think the sound is coming from, and then record the arc length along the circle between the laser point and the tone generator. Repeat the process of spinning them and starting the generator 4 more times to get 5 trials, and then vary the sound in the right channel to 500, 1000, 2000, and 4000 Hz and repeat.
Processed Data Tables (Raw Data Appendix A) Top
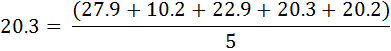
Table 1 has the average distance
from source of the different trials as given by the equation
![]()
Example Calculation:
|
Table 1. Effect of Overlaid Frequency on Average Distance from Source |
||
|
Frequency (Hz) |
Average Distance from Source (cm) (+/-0.5 cm) |
|
|
250 |
20.3 |
|
|
500 |
38.6 |
|
|
1000 |
58.4 |
|
|
2000 |
44.7 |
|
|
4000 |
15.2 |
|
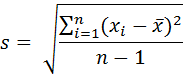
Table 2 contains the statistical tests that were performed on the average distances from source from Table 1. The first test is the Standard deviation which is a measure of how far values fall from the mean and is given by the equation:
Example Calculation:
![]()
The next calculation is the standard error of the mean which is the standard deviation of the sample mean and is given by:

Example Calculation:

The final calculation is the 95% Confidence Interval which when added to and subtracted from the mean will give a range that the true mean can be said to fall on with 95% certainty, note that for this lab a 95% certainty threshold was selected and the appropriate value looked up in a t-table (SJSU). It is given by:
![]()
Example Calculation:
![]()
|
Table 2. Statistical Tests on Average Distance from Sound |
||||
|
Frequency (Hz) |
Standard Deviation |
Standard Error of the Mean |
95% Confidence Interval |
|
|
250 |
6.5 |
2.9 |
6.1 |
|
|
500 |
17.2 |
7.7 |
16.3 |
|
|
1000 |
28.3 |
12.7 |
26.9 |
|
|
2000 |
12.9 |
5.8 |
12.2 |
|
|
4000 |
9.6 |
4.3 |
9.1 |
|
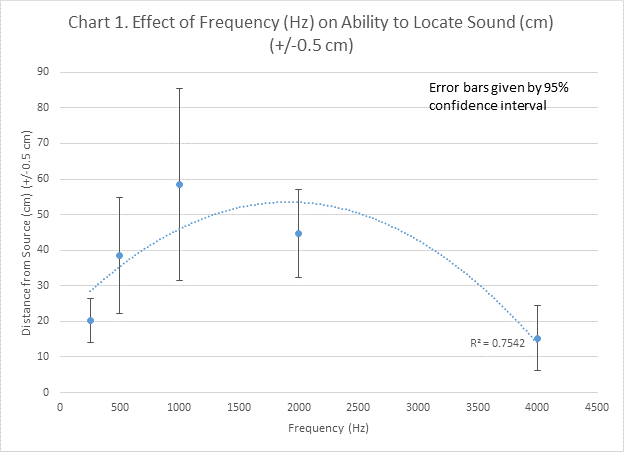
Chart 1 is a plot of the processed data from table 2 to make it easier to visually see the ranges that the true mean of the sections may fall on.
Conclusion Top
The hypothesis for this experiment was originally that if the overlaid frequency is put over a white noise and ranged from 250, 500, 1000, 2000, to 4000, then the ability of people to locate that source of noise will also decrease from approximately 20 cm accuracy down to 0 cm accuracy by steps of 5 cm correlating with the increase in frequency. This hypothesis was not supported by the data which followed a much more parabolic trend rather than a linear one. The first tested frequency of 250 Hz had an average distance from source of about 20.3 cm which was approximately what was predicted by the hypothesis. However, instead of decreasing linearly to 15 cm for the next frequency of 500 Hz, the actual average distance from source increased to 38.6 cm. This was followed by another increase at 1000 Hz which resulted in the largest average distance at 58.4 cm compared to the 10 cm that would have been predicted. Finally, 2000 and 4000 Hz both decreased in average distance from source with 44.7 cm and 15.2 cm respectively which made them fall in line with the parabolic trend that was observed. Also of interest to note is that the 95% confidence interval, which is the range that the true mean can be said to lie on with 95% certainty, also followed a parabolic trend ranging from relatively low values at 250 and 4000 Hz with 6.1 and 9.1 for each. While it reached its zenith at 1000 Hz with a value of 26.9. This could suggest that it can become increasingly difficult to test ranges in the middle of human hearing where the clear tone and white noise are similar in how loud they sound to people. Overall though the hypothesis has to be rejected as the observed data did not follow a linear relationship that was predicted.
There are some sources of error in this lab, particularly in the test subject’s interaction with the sound. Firstly, tests become increasingly less accurate towards the middle of the tested ranges as these clear tones were about as loud sounding as the accompanying white noise. This could have in turn shifted the importance of the actual frequency of the clear tone in being able to locate sound to how the test subject’s head was positioned in regards to the sound source, as the differing highs and lows in the generated tones may have had a greater effect on how difficult the laptop was to locate. Additionally, the testing environment was not completely sound proof, and ideally this would be corrected in a future experiment. That being said though ambient sound can be reduced and low amounts of noise have little to no effect given the fairly close proximity of the sound source and the test subject. Finally, the laser pointer was not held perfectly steady which could have introduced some error into the tests, so creating a head mount that could have the laser pointer strapped in and held more firmly may be a correction if the test were to be performed again.
http://www.acousticfields.com/white-noise-definition-vs-pink-noise/ - This website helps to explain what white noise actually is in terms of physical properties which helps to make the lab easier to understand
http://www.learnnc.org/lp/editions/biomusic/6517 - This website talks about how sound travels through different environments which can be helpful to understanding sound waves themselves
http://www.researchgate.net/post/Why_do_we_need_to_compute_power_spectral_density_for_any_signal - This website talks about the uses of the power spectral density, and why we might want to calculate it for a given sound wave
https://www.wavemetrics.com/products/igorpro/dataanalysis/signalprocessing/powerspectra.htm - This website details the actual power spectral density use in greater detail and provides some more technical information
http://phys.org/news/2008-01-localize.html - This website gives a brief overview of how humans are able to localize sound based on common biology
Appendix A. Raw Data Top
|
Table 1. Raw Data |
|||||
|
Frequency (Hz) |
Distance from Source (cm) (+/-0.5 cm) |
||||
|
Trial 1 |
Trial 2 |
Trial 3 |
Trial 4 |
Trial 5 |
|
|
250 |
27.9 |
10.2 |
22.9 |
20.3 |
20.2 |
|
500 |
12.7 |
30.4 |
45.7 |
55.9 |
48.3 |
|
1000 |
73.7 |
30.5 |
53.3 |
35.6 |
99.1 |
|
2000 |
63.5 |
48.3 |
40.6 |
27.9 |
43.2 |
|
4000 |
5.1 |
12.7 |
17.8 |
30.4 |
10.2 |
Bibliography Top
Foley, Dennis. White Noise vs Pink Noise. 12 February 2014. <http://www.acousticfields.com/white-noise-definition-vs-pink-noise/>.
Hall, Debra and Crystal Patillo. How Does Sound Travel in DIfferent Environments. n.d. Web Site. 4 Januargy 2016.
Schilndwein, Fernando Soares. Why we need to computer power sepctral density. 1 November 2013. <http://www.researchgate.net/post/Why_do_we_need_to_compute_power_spectral_density_for_any_signal>.
SJSU. "T-Table." 14 7 2007. Reference Table.
WaveMetrics, Inc. Power Spectra. August 2007. <https://www.wavemetrics.com/products/igorpro/dataanalysis/signalprocessing/powerspectra.htm>.
Zyga, Lisa. How we localize surround sound. 9 January 2008. <http://phys.org/news/2008-01-localize.html>.