|
[ |
|
How does the temperature
around a flute affect the frequency of the instrument? |
Table of Contents
Background (Top)
Music
is a huge part of our culture’s idea of “entertainment.” Among other cultures,
music is an offering, a ritual, or just something fun, which is similar to our
idea of it being entertainment. Western music has been developing for hundreds
of years, dating way back before the Middle Ages (Pincherle,
1959). According to Kepler (2002), the harmonics of
music were discovered way back when the Greek philosopher and mathematician,
Pythagoras of Samos studied them sometime between 580 B.C.E. and 500 B.C.E, and
thus studies of harmonics were born.
In the musical realm
of physics, we have discovered that the frequency
of a note is what produces the sound of the note. Depending on the length of
that portion of frequency, which is called the wavelength, it can
produce different sounding notes. Noted by the Physics Classroom, one cycle of
this wavelength per second is 1 Hertz (abbreviated to Hz). According to
“Sensitivity of the Ear,” the human ear can hear frequencies ranging from 20 Hz
to 20,000 Hz. The frequency is dependent on the wavelength and speed of the
wave length. If the wavelengths were produced on a graph, it would look similar
to a sine wave.
Wavelengths
are defined as including one wave crest and one wave trough. The wave crest is
when the wave goes up, creating a hill if you were to see it. The wave trough
is when the wave goes down, creating a dip in the wave. With these waves, we
can determine the frequency.
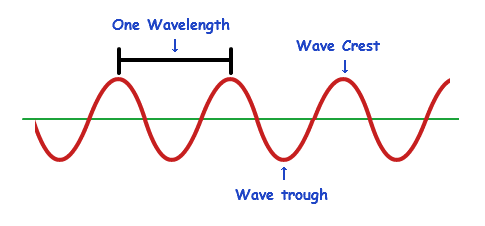
Taken from TutorVista.com
With
a flute, the air is played through a hole at one end of the instrument, and the
air bounces through the instrument in the motion of a wavelength, creating
vibrations through the instrument. In a concert flute, it is open only on one
side, so the wavelengths are in halves.
Many
musicians have discovered that the temperature in which they play their
instruments affects the frequency, causing the pitch to either go down (become
flat) or go up (become sharp). Whether the frequency increases or decreases
depends on the temperature of the air blown through it and the air outside of
the instrument.
Hypothesis (Top)
I believe
that when the temperature is warm outside the instrument (assuming that the air
played through the instrument is at a constant temperature) the note is more
likely to be sharp, meaning that the frequency will be much higher. On the
other hand, when the temperature outside the instrument is cold, the frequency
will be lower, creating a flat pitch.
Variables (Top)
My independent variable is the
temperature that the surrounding air of the instrument is in. My dependent
variable is the frequency of the pitch played by the instrument. The control variables include, but are not limited to, the note
played (the initial frequency), the instrument used, and the air temperature
played into the instrument.
Set Up and
Procedure (Top)
For
my materials, I used an old weather station, my Andreas Eastman flute, and a tuning
app on my phone. The weather station calculated the temperature of the room in
Fahrenheit, so I had to calculate the Fahrenheit into Celsius. The flute used
was silver-plated, and had a silver and nickel body and keys (because the metal
affects the temperature of the instrument depending on the conductivity of the
metal). The tuning app was called “Easy Flute Tuner,” and the calculation of
the frequency was all the way to the second decimal.
First, I set
up my weather station and tuner in my living room, which is where we keep all
of our instruments. This was going to be my control room. I played the A note
below middle C which should have the frequency of 440 Hz when in perfect pitch.
I played the same note each time, playing it several times and for the duration
of about three seconds. I then recorded the frequency that came up on the app
and the temperature that was presented on the weather station. I repeated this
for four other rooms: in the bathroom after someone took a shower, in a sauna,
in my garage, and in a large freezer.
Data and Findings (Top)
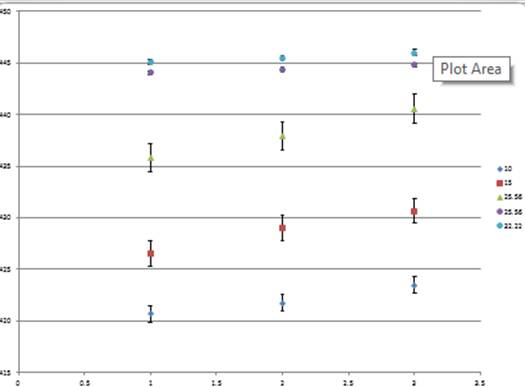
In
the control room, the temperature was about 20.56 degrees Celsius on average,
and the average frequency of the notes was about 438.087 Hz. For the bathroom,
the average temperature in Celsius was about 25.56 degrees, and the average
frequency was about 444.39 Hz. In the garage, the average temperature was about
15 degrees Celsius, and the average frequency was about 428.717 Hz. In the
sauna the average temperature was about 32.22 degrees Celsius, and the average
frequency was about 445.53 Hz. Finally, for the freezer, the average
temperature was about 10 degrees Celsius, and the average frequency was about
421.94 Hz.
What I found
between the data from each of the rooms was that the control group had the most
uncertainty between all of the rooms, but the garage was not very far behind.
The bathroom and the sauna had significantly less uncertainty, and I believe
this is due to the temperature of the air going through the instrument (which I
will touch more on in my conclusion). The uncertainty of the garage was about
±2.093 Hz and the control room’s uncertainty was about ±2.399 Hz while the
bathroom had the uncertainty of about ±0.364 Hz. The sauna had an uncertainty
of about ±0.457 Hz, and the freezer’s uncertainty was about ±1.407 Hz.
Conclusion (Top)
The data that was tested proved my hypothesis of warm temperature increasing frequency and cold air decreasing frequency. The warm air was above the initial pitch by about five Hertz on average while the cold rooms were below the initial pitch by about 10 to 15 Hz on average. The control was below the initial pitch by about two Hertz on average. One interesting thing found in the research was that the frequencies had less uncertainty in the warmer rooms than the frequencies from the other rooms, and I believe that is due to the air played through the instrument. Generally, the air played through a flute by a person will be warm, which is a factor in warming the instrument. This could possibly be the reason that the colder temperatures had significantly larger uncertainty. Also, the data found that the trend of the frequencies each time they were played in each room increased each time, which could also be a result in the air temperature played within the instrument. Other errors could include the position of the head joint on the instrument. The head joint is the part that helps tune the instrument (pushing in will increase the frequency while pulling out will decrease the frequency). Also, rolling the instrument in or out changes the frequency (rolling away from the mouth increases frequency while rolling towards the mouth decreases frequency). The head joint was most likely not in the same position every time it was played. Also, the technology used in the experiment could be unreliable; the weather station I used was pretty old, and the app I used was a free app that I found on Google Play, so that may not be the most reliable also. If one were to re-conduct this experiment, they might want to use more reliable technology.
Related Websites:
[X]
How to play harmonics on the flute.
[X]
More how to play.
[X]
Physics of the flute.
[X]
Physics of the flute.
[X]
Tips for playing harmonics on the flute.
Bibliography
for the Background Information (Top)
"Frequency and Period of a
Wave." Frequency and Period of a Wave. The Physics Classroom, n.d. Web.
"Sensitivity of the Human
Ear." Hyper Physics. N.p., n.d. Web.
"Wavelength to Frequency." Tutor
Vista. N.p., n.d. Web.
"Flute Harmonics." Flute
Harmonics. Flute Tunes, n.d. Web.
Marc Pincherle.
An Illustrated History of Music. New York: Reynal,
1959. Print.
Kepler, Johannes, and Stephen Hawking. Harmonies of the World.
Philadelphia: Running, 2002. Print.