A Hoppin’ Topic: The Effect of Height on a Golf Ball’s Bounce
Background:
There is more use to a golf ball than just a simple round of golf. Golf balls, which have anywhere from 300-500 dimples on their hard plastic shell, have a rubber center which makes them the perfect subject of any science experiment involving bouncing.
A ball dropped vertically onto a surface experiences a vertical impulsive force (Cross). When dropped, the ball bounces off the ground and gains potential energy on its way back up. The farther apart the ball is dropped from the surface below, the higher it will bounce back up. The ball can never bounce back to its original height (Cross) because as the ball falls, it loses some of its energy to different variables such as air friction and the friction between the ball and the ground. The ball will deform during the impact while the center of mass tries to keep going, but the surface it hits is trying to stop it, which eventually results in elastic deformation (“Why”).
When the ball makes initial contact with the surface, it slows down. The velocity will still be pointing downward, but the deformation of the ball will cause the acceleration to point upward. After the surface has caused the ball to substantially deform, it's pushing against the surface with a force greater than its own weight (“Bouncing”) will result in the ball bouncing back up in the direction it came from.
After each interaction with the ground, the ball will bounce back up to a fraction of the height it came from. In other words, the ball will go less high after each bounce. Eventually, the ball will not have any energy left, and it will fail to bounce back up at all.
Statement of the Problem/Question:
The purpose of this investigation is to determine how the height in which a golf ball is dropped affects the time it takes the ball to bounce five times. The question I will answer is how the time of five bounces is linearly and proportionately related to the height from which the golf ball is dropped.
Variables:
My variables are drop height, the time it takes the ball to bounce, the surface, the mass of ball, and number of times the golf ball bounces. The height H from which the ball is dropped must be the independent variable because I am the one who decided the intervals, and since the time T of five bounces varies based on the height from which the ball is dropped, that makes it the dependant variable. The variables that remain constant throughout the entire experiment are the ground or bouncing surface, the mass of the golf ball, and the number of bounces.
Hypothesis:
If the golf ball is dropped from a smaller height, the time it takes the ball to bounce five times will be smaller in comparison to larger heights because the ball has less height to try to bounce back to. The length between where the ball is dropped and the surface in which the ball will bounce off of (the ground) is the height H of this experiment.
In order to conduct this experiment, I will need the following equipment: a meter stick, one golf ball, an iPhone (to be used as a stopwatch and a camera), the concrete ground in my garage, and writing materials. Once I have collected all of these, I will label each height interval (the independent variable) on a pole in the center of my garage. I will be measuring drop times for a total of nine different heights, starting with 20 cm and increasing in 10 cm intervals until 100 cm.
To measure the dependent variable, which is the time of the drop in seconds, I will drop the golf ball from each designated height five times in order to ensure an accurate average. Once I drop the ball for each trial, I will hit start on the timer and not stop it until I see and hear the fifth bounce.
Before I conducted the experiment, I swept the floor around the pole in my garage to make sure that the surface was clean and would remain constant throughout the experiment. With the floor being concrete, it was easy to hear and see the golf ball bounce.
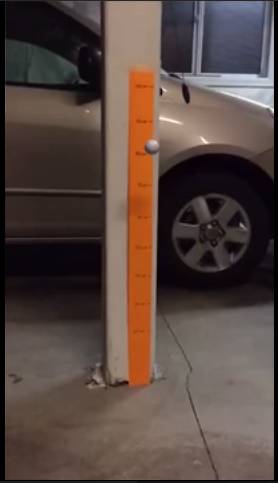
Screenshot of one of the trials
DATA COLLECTION AND ANALYSIS .:. Go Up
Raw Data:
* The trials represent the Time T of each drop (5 bounces) in seconds.
|
Drop Height H (cm) Uncertainty 0.3 cm |
Trial #1 |
Trial #2 |
Trial #3 |
Trial #4 |
Trial #5 |
|
20.0 |
1.65 |
1.36 |
1.55 |
1.68 |
1.51 |
|
30.0 |
1.93 |
1.94 |
1.78 |
1.93 |
1.83 |
|
40.0 |
2.18 |
2.33 |
2.15 |
2.26 |
2.16 |
|
50.0 |
2.56 |
2.48 |
2.48 |
2.33 |
2.45 |
|
60.0 |
2.72 |
2.60 |
2.75 |
2.66 |
2.78 |
|
70.0 |
2.78 |
2.88 |
2.95 |
2.92 |
2.78 |
|
80.0 |
2.96 |
2.98 |
2.93 |
2.95 |
2.95 |
|
90.0 |
3.15 |
3.16 |
3.23 |
3.28 |
3.21 |
|
100.0 |
3.33 |
3.46 |
3.31 |
3.41 |
3.36 |
I estimated the uncertainty of the height to be approximately 0.3 cm based on the assumption of my own personal human error. It is practically impossible to say that I dropped the golf ball from the exact same height for each trial, so I assumed a small uncertainty.
When calculating the uncertainty of the time it took the ball to bounce 5 times, I started by taking the difference of the greatest and smallest time for each of the nine different heights in order to find the range of uncertainty. The numbers I calculated were 0.32 sec., 0.16 sec., 0.18 sec., 0.23 sec., 0.18 sec., 0.17 sec., 0.05 sec., 0.13 sec., and 0.15 sec. Then I found the average of those values to be 0.174 sec. Half of the range is 0.087 sec or ±0.1 sec.; however, eight of the nine ranges were greater than this value. I concluded that the uncertainty for time is closer to ±0.2 sec. realistically. In addition, the line of best fit, when graphed, goes through every error bar with the uncertainty of ±0.2 sec. which was not the case with the uncertainty of ±0.1 sec.
The next step is for me to process my data and calculate the average times.
Using a calculator, I found the average time at each height by finding the sum of all of the trials from that height, and divided that sum by the number of trials (which was a constant 5 throughout the calculations). Typically, finding the average should help decrease the uncertainty, but I will keep ± 0.2 sec. due to the mass range of uncertainties for my different heights. Until I have calculated my final answer, I will not round any of my numbers.
Calculated Average Times:
|
Drop Height H (cm) Uncertainty 0.3 cm |
Average Time of 5 Bounces T (sec.) Uncertainty 0.2 |
|
20 cm |
1.550 1.6 |
|
30 cm |
1.882 1.9 |
|
40 cm |
2.216 2.2 |
|
50 cm |
2.460 2.5 |
|
60 cm |
2.702 2.7 |
|
70 cm |
2.862 2.9 |
|
80 cm |
2.954 3.0 |
|
90 cm |
3.206 3.2 |
|
100 cm |
3.374 3.4 |
From this data, I will
create a linear graph with the same slope of the line of best fit, with error
bars that represent the 95% Confidence Interval. The 95% Confidence Interval is
calculated with this formula:![]()
The X value in the equation stands for the mean or average time the ball dropped which is different for each trial. The value of t(S/√n) is defined as the margin of error where t is a critical value determined by the tn-1 distribution where the area between t and -t is .95 under the bell curve of this particular confidence interval and (S/√n) represents the standard error.
The confidence level is used to prove or disprove the expectation of the values of data points collected during the experiment. With the formula, it is assumed that 95% of the data collected will fall within the calculated values, which proves the conclusion to be more consistent and accurate.
In order to calculate the
uncertainty of the line of best fit, I must calculate the slopes of the maximum
and minimum graphs. 
Using the above formula, I used the first and last point of both the Min. and Max. graphs in order to calculate their slopes. In the end, I concluded that the slope of the line of best fit had a slope of 0.022 s/cm, the slope of the minimum was 0.0175 s/cm and the slope of the maximum was 0.0275 s/cm.
To find the range, I simply found the difference of the Min. and Max. Slopes which was equal to 0.01. Then I simply divided that value by 2 in order to find the uncertainty of the line of best fit.
The slope and its uncertainty are written: M = 0.022 ± 0.005 s/cm
In order to calculate the percent error, I divided the final uncertainty by the slope and multiplied that value by 100. My final answer was approximately 22.7% which is substantially higher than I would have hoped, which means much error occurred throughout my experiment.
Based on the results of my experiment, I proved my hypothesis to be completely correct. I assumed that, if dropped from a smaller height, the time it would take a golf ball to bounce 5 times would be substantially faster than it would if dropped from larger heights. This was also proven when I graphed my data because, as shown on the second graph, the averages from the lower drops fall under the line of best fit indicating that they are different than the higher averages. As the height at which the ball was dropped from increased, so did the time, which resulted in a linear function. My hypothesis was correct because I knew that if dropped from a smaller height, the golf ball would take a smaller amount of time than if dropped from a larger height. Even though the ball was able to gain speed a fall faster from larger heights, it still took more time to get to the ground.
Although I was able to prove my hypothesis to be correct, there were many sources of error in my experiment, as made clear by my substantial percent error and the scatter of data points on my graph. First of all, the environment in which I conducted my experiment, the concrete floor of my garage, had dirt and debris on the ground along with cracks in the floor which caused the ball to bounce even farther away from the original drop point with each bounce. In addition, it was difficult to drop the ball from the consistent and accurate height intervals each trial. That source of human error may have added to the inaccuracy of the data and was the reason I assumed height uncertainty. Finally, while conducting this experiment alone, the accuracy of when I started and stopped the timer on my iPhone could not have been the most accurate way to measure time. Especially since I had to stop the timer after the fifth bounce, my experiment relied heavily on my ability to be consistent.
There are many ways in which I could have improved my design in order to make my experiment more accurate. To eliminate any error with the environment, I could conduct this experiment in a clean classroom with smooth, tile flooring. If I want to control the consistency of where the golf ball bounces, I could perform the experiment in a tall box or very small section of a room; however, this would greatly affect the energy the ball has while bouncing and possibly invalidate the results. The design of my experiment called for waiting for the golf ball to bounce five times, which was difficult to measure accurately. Next time, I could use data logging equipment and computer programs in order to measure the ball and the time it takes to bounce. That way, I would not have to rely on the sound of the bounce to know when to stop recording the time. This would greatly improve the scale of time and the procedure overall. The relationship of time compared to the drop height of a ball with a certain number of bounces is not a relationship found in any physics unit we have explored, but it was something I was interested in determining.
http://www.real-world-physics-problems.com/bouncing-ball-physics.html - This source does an excellent job at explaining the manipulation of the ball’s shape that occurs during and after its impact with the ground.
http://www.physics.usyd.edu.au/~cross/PUBLICATIONS/BallBounce.pdf - This source demonstrates the dynamics of not only a golf ball, but numerous types of balls with the intention of comparing them while also going into detail about the mechanics of the balls’ bounce.
http://www.physics.usyd.edu.au/~cross/BOUNCE.htm - This source goes into detail about the ball’s grip with the ground once it comes in contact with the ground.
http://physics.stackexchange.com/questions/117091/why-does-a-ball-bounce-lower - This source goes into detail about the compression a ball experiences once it hits the ground during its bounce while discussing factors of velocity and acceleration.
http://www.physicscentral.com/explore/pictures/bouncingball.cfm - This source has an excellent image that shows the decrease in height after each trial.
"Bouncing Ball Physics." Real World Physics Problems. N.p., n.d. Web. 29 Nov. 2015. <http://www.real-world-physics-problems.com/bouncing-ball-physics.html>.
Cross, Rod. "The Bounce of a Ball." Am. J. Phys. American Journal of Physics 67.3 (1999): 222. 17 Feb. 1998. Web. 29 Nov. 2015. <http://www.physics.usyd.edu.au/~cross/PUBLICATIONS/BallBounce.pdf>.
Cross, Rod. "PHYSICS OF BOUNCE." Sydney Physics. Sydney University, June 2014. Web. 29 Nov. 2015. <http://www.physics.usyd.edu.au/~cross/BOUNCE.htm>.
"Why Does a Ball Bounce Lower?" Physics: Kinematics. Stack Exchange, 12 Aug. 2014. Web. 29 Nov. 2015. <http://physics.stackexchange.com/questions/117091/why-does-a-ball-bounce-lower>.