The Effect of Friction on Horizontal Velocity
Ryan Houlberg, Noah Peepersen, David Johannesen, Trung Tri, Caleb Peeperson
Hot Wheels are die-cast model vehicles manufactured by Mattel and were introduced in 1967 (Leffingwell, 2003).. Originally the cars and trucks were manufactured to approximately 1:64 scale and designed to be used on associated Hot Wheels track sets. By 1972, however, a series of 1:43 scale "Gran Toros" made by Mebetoys in Milan, Italy, were introduced. More recently, a range of highly detailed adult collector vehicles, including replicas of NASCAR and Formula One cars, have found success (PR Newswire UK 1999). Despite the forays into larger scales, the brand remains most famous for the small scale free-rolling models of custom hot rods and muscle cars it has produced since the range first appeared. Roughly 10,000 or more different models of Hot Wheel Cars have been produced over the years (Wikipedia, 2012).
Due to their booming popularity and fan base Hot Wheels has surrounding it, it only seemed logical to introduce race tracks for children to race their miniature vehicles against each other. This is how many young children got introduced to the idea of friction. Friction comes in two forms: static and kinetic. Static friction arises between two objects that are not in motion with respect to each other, as for example between Hot Wheels car and a race track.. It increases to counterbalance forces that would move the objects, up to a certain maximum level of force, at which point the objects will begin moving. This is where kinetic friction kicks in. Kinetic friction happens between bodies that are in motion with respect to each other, as for example the force that works against pushing a Hot Wheels car along a plastic racetrack (American Heritage Science Dictionary, 2010).. This experiment will investigate the nature of friction using these miniature cars as tools for experimentation.
Statement of the Problem Table of Contents
The purpose of this investigation is to analyze the correlation of friction between a Hot Wheels car and a plastic racetrack.
We believe that if a toy car is rolled off of a table on a track of varied lengths, then the force of friction acting on the car will increase linearly with distance thus detracting linearly from the velocity, because the force of friction will be applied equally since the vehicle and track remain the same. The independent variable in this investigation is the horizontal length of the track, with the dependent variable being the distance the car travels after falling off the end of the table. Controlled variables include, but are not limited to, the angle of the beginning ramp, the mass of the Hot Wheels car, and the height of the table. The primary equation being utilized will be Ek = 1/2mv^2 (Murray).
For our experiment, we had to
procure a number of materials. Our materials included: a Hot Wheels car, 8
lengths of track, a table, a tape measure, tape, and a Hot Wheels launcher. We
set up the launcher, which was effectively an elevated platform with a tab to
hold Hot Wheels cars. Connected to that were two lengths of track that were
long enough to reach the table, which was our first ramp length test. For each
test, another length of track was added, and the launcher was moved back so
that the edge of the track would be flush with the edge of the table. We then
taped down the end of the track to prevent more error. When the car was
launched, it would roll down the track and fall off of the table, where two
spotters would be watching to see where the car landed. The closest point of
where it landed was measured to the edge of the table (only horizontal distance
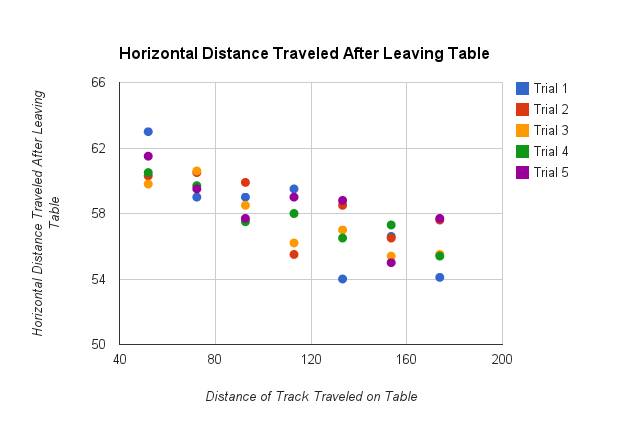
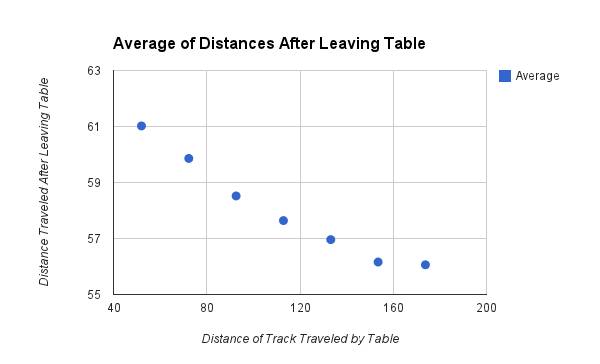
Raw Data
|
Ramp Distance (m) |
Trial 1 |
Trial 2 |
Trial 3 |
Trial 4 |
Trial 5 |
Averages |
|
.52 |
63 |
60 |
59.8 |
60.5 |
61.5 |
61.02 |
|
.723 |
59 |
60.5 |
60.6 |
59.7 |
59.5 |
59.86 |
|
.946 |
59 |
59.9 |
58.5 |
57.5 |
57.7 |
58.52 |
|
1.129 |
59.5 |
55.5 |
56.2 |
58.0 |
59.0 |
57.64 |
|
1.332 |
54 |
58.5 |
57.0 |
56.5 |
58.8 |
56.96 |
|
1.535 |
56.6 |
56.5 |
55.4 |
57.3 |
55 |
56.16 |
|
1.738 |
54.1 |
56.5 |
55.5 |
55.4 |
57.7 |
56.06 |
 *
*
Data Files:
Text1 .:. Text2 .:.
Text3 .:. Text4 .:.
Excel
Numbers in reference to statistics associated with the car as it leaves the track on the table before it falls.
From the height of the table and the acceleration of gravity from a starting vertical velocity of 0, we can determine the time the car took to fall by using the equation s=ut+1/2at^2 rewritten as t=sqrt(2s/a) because u=0 so it can be eliminated.
That can then be used to find the horizontal distance of the car since we measured the horizontal distance it traveled, and because air friction can be neglected due to the low velocity and aerodynamic shape of the car.
s/t=v, (meters divided by seconds=meters per second)
The potential energy of the car at the top of the ramp was calculated using the formula
Ep=Mgh
The energy from the ramp is then converted into horizontal velocity because the car
Knowing the velocity, then the kinetic energy of the car can be calculated, using
Ek=1/2mv^2
The potential energy of the car at the start when it’s at the top of the ramp was calculated using the formula
Ep=Mgh
This can then be used to calculate the theoretical frictionless velocity using Ep=Ek=1/2mv^2,
Since without friction, all of the potential energy from the ramp would be converted into kinetic energy according to the Law of Conservation of Energy.
The last two calculations are valuable as a way to see how much energy or velocity is lost to friction.
Line of Best Fit for Energy Loss to Friction Table of Contents
(S=distance, Ek=Kinetic Energy)
Ek= -.006894(S)+.055288
Energy reduced by .006894 J/m
Loses 0.046917028835 J to static Friction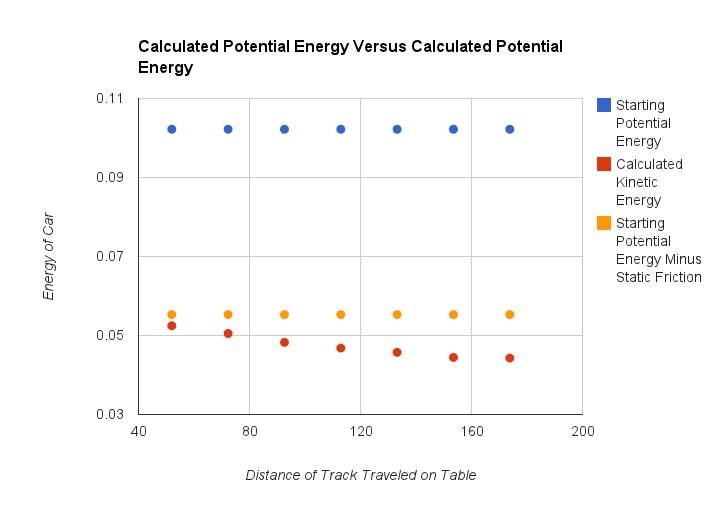
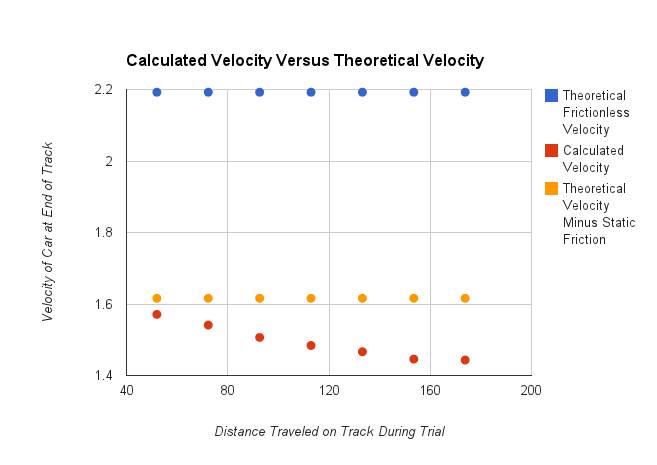
Line of Best Fit for Velocity Loss to Friction
(S=distance, V=Velocity)
V= -.00108(S)+1.616
Velocity Reduced by .00108 m/s
Loses 0.576464366871216 m/s to static Friction
The results of the experiments supported our hypothesis that loss of velocity to friction would increase at a linear rate, meaning that velocity decreases at a linear rate. The velocity of the car as it left the table decreased close steady -.00108 meters per second per meter traveled, with the exception of the final point on the graph which could be due error. Additionally, looking at the kinetic energy of the car shows a similar trend, with a .006894 Joule per meter decrease in kinetic energy, again except for the last point, which is most likely due to error.
That error could be because, despite most of the variables such as the potential energy from the ramp, the angle at which the car left the table (0 or 180 degrees, take your pick), and the height of the table were controlled, there was one potentially significant source of error. In measuring the distance the car was from the table, human error factors in through a somewhat crude method of marking was used, namely Ryan, after the car landed and often rebounded or otherwise moved away from it’s original impact location. Although the error cannot be measured, the fact that the same person marked the spot does help because that one person most likely would make some error, but is more likely to make that error consistently, thus maintaining the relationship between the data points in the result. Additionally, the relatively small changes between the distances of track used to measure friction between the car and track limit the data somewhat because the data provides a fairly narrow frame of reference. This means that while in the small range of data, this is fairly accurate, but extrapolating beyond that range could potentially result in a different conclusion.
This is valuable because for future experiments that relate to friction because assuming that the rate at which friction is applied as well the static friction are known (which would vary based on surface and vehicle), then distance would not necessarily have to be controlled. This is because any calculations could have the rate of friction factored in in such a way that the distance a vehicle traveled becomes irrelevant and other factors could be considered.
1.
BBC News. BBC, n.d. Web. 28 May 2013.
2. "FearOfPhysics.com: Friction." FearOfPhysics.com:
Friction.
N.p., n.d. Web. 28
May 2013.
3. "The Force of Friction." The
Force of Friction.
N.p., n.d. Web. 28
May 2013.
4. "Friction Basics." Physics4Kids.com:
Motion: Friction.
N.p., n.d. Web. 28
May 2013.
5. "Friction Science Definition." Friction.
N.p., n.d. Web. 28
May 2013.
http://www.physics4kids.com/files/motion_friction.html great website for learning the basics of friction
http://hyperphysics.phy-astr.gsu.edu/hbase/frict.html helpful information on fundamentals of friction science
http://www.bbc.co.uk/schools/scienceclips/ages/8_9/friction.shtml walkthrough on some of the key elements of friction
http://www.fearofphysics.com/Friction/frintro.html good website for learning about friction
http://www.regentsprep.org/regents/physics/phys01/friction/default.htm
Good explanation about how friction works.