Method: .:. Top
Using a scale (accurate to the gram) measure the amount of volume that each of the five glasses of varying shape can hold. Then, with a calculator, determine the volumes specific to each glass that correspond to 1/8 of the volume. These are the ratios of fullness. At each ratio agitate the rim of the glass, and measure the frequency produced. This is measured using an online tuner that is accurate to the hundredths. Based on the frequency, use a nearby piano to determine the note produced. Repeat this process with the four remaining glasses at each of their respective ratios of fullness, starting by placing the crystal glasses still containing water on the scale and utilizing the scale’s zero-ing function to accurately fill the container to the necessary amount of volume. Subsequent to measurements, analyze the intervals between the corresponding ratios of volume in each of the glasses. Examine these to determine a relationship between glass shape, volume, and frequency.
List of materials:
• 5 Crystal wine glasses
• 1 Laptop computer with turner software
• 1 Digital scale (accurate to the gram)
• 1 Tap (for water)
• 1 Graduated cylinder
• 1 Measuring cup (for adding water to glasses)
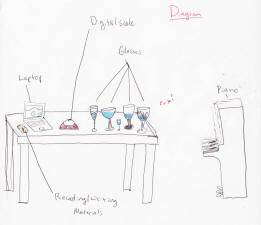
Diagram: .:. Top


Glass 1 Glass 2 Glass 3 Glass 4 Glass 5
Lab Setup was simple, and consisted of a digital scale, the glasses (numbered), a piano, a laptop with the online tuning program open, and recording/writing materials.

(the x-axis is in hundreds of milliliters...)
Data file: text .:. Excel .:. Top
Results: The data has an obvious downward trend. It was also found that the glasses maintained a constant relationship with one another even after the interval changed. More specifically it shifted from a tritone to a prefect fourth. This was a modal shift.
Conclusion: Our hypothesis was correct to an extent. We were correct that the intervals between frequencies in various glasses at equal ratio’s of volume remained constant. However, this only held true for the ratios between ¼ and 3/4. Between empty (the glasses’ natural frequencies) and 1/8-full, the notes remained constant, however upon reaching one quarter full, the intervals changed. Furthermore, after surpassing ¾ full, the intervals changed once again, but post-modulation, they remained constant. Specifically, tritone intervals were recurred frequently. Thus we concluded that the shape of the glass does not affect the way frequencies vary at different volumes. However, glass number 5 was an outlier in our data because it had geometric indentations on its outer surface. Because resonance occurs when the molecules of the glass are agitated and thereby the air particles and water particles around the glass are agitated, odd geometric designs on the glass must affect the frequencies produced. All of the glasses dropped in frequency proportionally as they were filled except for glass five. Glass number five dropped almost an entire octave between 7/8 full and completely full. The notes changed from a D to an E-flat, dropping 578 Hz from 1202 Hz to 624 Hz. We observed this to be uncommon by comparing it to the rest of our data. The uncertainty of the frequency was omitted from our calculations due to the fact that it was negligent (+/-.005 Hz). The uncertainty of volume is more considerable; it was +/-.5 milliliters. However, due to the fact that our x-axis on our scatter plot was based on ratios of volume, this uncertainty becomes negligible as well. Based on our data we concluded that the relationship between fullness and frequency must be a variation of a cubed root function, because each glass has its own specific range of obtainable frequencies, and thus both a maximum and minimum frequency. To further this research, one could potentially measure the affect that the purity of the crystal in each glass has on the range of frequencies that each glass contains. In addition, this would also make one wonder how the viscosity of the medium, which the sound must travel through in the glass, would affect the frequencies produced.
Error Analysis: Due to the fact that a different company has manufactured each glass, the pureness of the crystal varies with each glass. The definition of crystal is such that there is a large range of trace element that may be found in the material that will still allow the material as a whole to be classified as crystal. This may have affected certain frequencies minimally, but to a big enough extent that it could have altered our measured notes by a ¼ step. We also utilized an online frequency calculator. We cannot be sure if this technology is 100% accurate. While in use, the computer software observed frequencies that included undertones and overtones of the produced note. When the glasses were at the 100% full mark, the computer picked up other occurring frequencies that may have been more perceivable electronically than those of the wine glasses (specifically those of the finger rubbing on the glass). Also, in order to make a wine glass “sing”, one must agitate the rim with a wet fingertip. This may have marginally influenced the amount of water in the glass, and thus altered the produced frequency.
October 2010
Planning day: As a group, we decided on a topic. We wanted to find a subject that was interesting to every member of our group. Thus we decided to pick something that incorporated music and physics into a single project. The product was the resonance of wine glasses. However, we did not come to this conclusion without some debate. Originally we were considering observing the change in frequency, produced by a wine glass, based on the liquid in the glass. However we were more interested in the intervals produced among various shapes of crystal glasses. In the end, we decided to research the effect of shape and ratio of fullness in a wine glass, in relation to the frequency produced.
November 2010
Data Collection: To begin collecting our data, we chose two crystal glasses of varying shape and recorded the frequencies that were produced when the glasses were agitated. We began by recording the natural frequencies of each glass, concluded that their frequencies were a tritone apart. We then recorded the quarter levels of “fullness”, and at each interval the difference in frequencies turned out to be a tritone. However, the only inconsistent level happened to be at 100% full. We estimated the relationship to either be a branch of an xsin(x) function or a cubed root function.
December 2010-January 2011
Further Data Collection/Presentation Prep: We measured the total volume of five different crystal glasses, and based on these measurements we recorded frequencies for eighths of volume for each of the glasses. Subsequently we graphed our data and drew conclusions based on our data. We also worked on our powerpoint slides and diagrams of our lab setup.
Bibliography/ Related Websites .:. Top
Works Cited
1.) Bourne, Murray . Interactive Mathematics. 24 Oct. 2000. 24 Oct. 2010
2.) , Diy Awards. www.etchedcrystals.com/knowledge/Crystals-versus-Glass.html. 24 Oct. 2006. Engraved Crystal Awards & Plaques. 24 Oct. 2010 <http://www.etchedcrystals.com/>.
This site enabled us to understand the differences between Crystals and Glass. It also helped us learn about the purification process of glass.
3.) Suits, B. H. Physics of Music-Notes. 24 Oct. 1998. Michigan Technological University. 24 Oct. 2010 <http://www.phy.mtu.edu/~suits/notefreqs.html>
This site showed us the accepted frequencies for every note on a piano.
This site shows how to break a crystal glass with sound, which gives insight into how resonant frequencies work.
5.) http://www.youtube.com/watch?v=q4setd7BZWM&feature=player_embedded
This is a lecture that discusses the way sound moves in a wine glass, and explains the physics of waves explaining how the frequencies are produced (his word choice is also rather hilarious).