Formerly “The Decay of a Battery’s Ability to Hold a Charge after Repeated Uses and Recharges”; now “Creating a Model of How a Rechargeable Battery Discharges”
By: Evan Pinckard and Grant Gholston
The generic alkaline battery that you’re probably using in your very calculator is something of little significance to you until it runs out. These batteries use a reaction between zinc and manganese oxide. Usually, the negative end of your battery is made of zinc, as this helps the reaction rate increase (notice that there is more surface area on this side). The positive end, by process of elimination, is the manganese oxide end. The electrolyte used in this reaction to produce our much-desired energy is potassium hydroxide (though it can be other things) [1].
The difference between a regular alkaline battery and a rechargeable battery is that rechargeable batteries use secondary cells. The most commonly known secondary cell is the lithium ion cell. The benefit of lithium ion cells is that they lose little charge when not in use. [2]
If you were to look at the batteries in your calculator, or just about any AA or AAA battery, you’d notice it says “1.5 Volts” on it. From this we can conclude that batteries are generally putting out ~1.5 Volts when in use (the batteries that we will use do, anyway). The question arises; when is it generally accepted that these rechargeable batteries do eventually lose their charge?
The purpose of this investigation is to find out how useful rechargeable batteries are and how well they hold a charge. This data will allow us to see if they are cost effective when compared to buying regular one-use batteries, as rechargeable batteries are much pricier.
We believe that after every usage of a rechargeable battery, the amount of energy it is able to store will diminish with limited exponential decay (we may or may not reach said limit). Energy is defined by how long the supply inside the battery maintains a consistent enough output to run an apparatus that it is suited for. Seeing as we will be using AA batteries, an example of a suitable apparatus would be a television remote or maybe a Wiimote. The controlled variables include, but are not limited to, the batteries, testing equipment/recording equipment, wire length and composition, and the recharging apparatus. The independent variables include how many times the batteries have each been discharged and recharged. Dependant variables include time until batteries discharge. Our accepted voltage output to determine the “constant” output will be defined as 1.5 Volts with a leeway of ±.15 Volts.
In order to test our battery, we used a fairly simple lab set-up. Our set-up consisted of our Sony Rechargeable Ni-MH batteries with a load on them of Zirconium wire (whose resistance measured around 10 Ohms). This was then hooked up to a computer using metal clips on each end of the battery in their respective positive and negative positions. These clips are compatible with Vernier’s “Go! Link” that was used to hook this all up to a computer to record data on Logger Pro 3.

(Schematic)
Our data was gathered using Logger Pro 3. Upon first plugging our device into the computer, Logger Pro recognized what the device was and a window reading “Potential” instantly came up, though I know this isn’t the case with every computer as I’ve had to set others to recognize the specific device I was using. Once that was done, the data collect window was then accessed. We set it to “continuous” so that it wouldn’t stop collecting data at any point, then we altered the Y-axis to never go below zero volts (0 V) and set it to a maximum of one and a half volts (1.5 V). From there, it just took a click of the “Collect Data” button followed by an attempt to forget that the computer was even doing it with intermittent check-ups on the data to see its progress, usually ending in a loud exclamation of “What!”
The reasons we decided to collect data in this way was because it was by far the easiest way to gather data on a battery’s discharge. The only factor that made this inconvenient was that it was attached to a laptop instead of a desktop, effectively turning the laptop into a “floortop,” as a touchy little AA battery on a plate inhibited all its mobility.
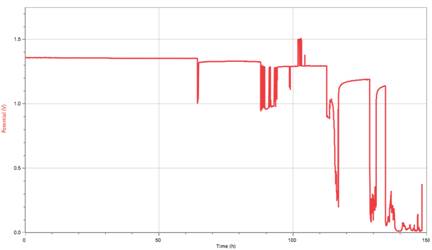
Our results reflect nothing pertaining to neither our original hypothesis nor our original question. Instead, our results reflect that of a model showing how a rechargeable battery’s discharge happens. We managed to actually get a trial that shows what is accepted as a standard discharge model of a rechargeable battery with our longest trial.
Data Files: Logger Pro
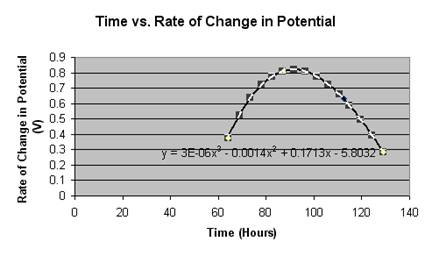
This graph illustrates the step-like decay a rechargeable battery goes at with roughly 80% of the battery’s working life within .2 volts of the stated potential on the battery (1.2 V). This has proven consistent with another’s research on Ni-MH batteries [3]. Something we looked at was the length of each step and how much each step varied with the previous step. With this, we found a quadratic model that nearly perfectly fit our data.
|
Time (Hours) |
Change in Potential (V) |
|
64 |
0.375 |
|
87.7 |
0.8125 |
|
112.4 |
0.631 |
|
129 |
0.285 |
As one can see, all the points fall onto the curve in a way that is virtually exact. What is being illustrated is that the battery, earlier on, will change very little in its potential, showing no recordable change in the first 60 hours. The first change, when compared to the rest, is relatively small with the following ones increasing in the amount of change until it hits a peak. Eventually, after the peak, the battery’s changes begin to decline again as it approaches the asymptote that is zero volts. This could be written as a limit expression.
Our data neither supported nor debunked our hypothesis. It, instead, was entirely insufficient and gave us something rather tangential while barely remaining relevant. We ended up, as said earlier, recreating another’s research by recreating the standard model for a Ni-MH battery’s discharge almost perfectly. The most exciting part of our conclusion was the model that Grant managed to find out of our accepted “best graph” (pictured above). With this, we found another way of expressing how a rechargeable battery discharges in a way other than saying “it looks sort of like this” while making awkward gestures with your hands that could be considered offensive. Instead, we can solidly say that a rechargeable battery’s discharge is strongly illustrated by a quadratic function. This is because of the nature of the chemical reactions taking place within the battery.
So, what ended up happening is this: instead of finding how much overall charge is held after repeated use, we created a mathematical model that illustrates how a rechargeable battery discharges. I found this to be very neat and nicely uniform. This made me extremely happy as for the longest time I thought I was getting incredibly erratic data from either the battery being faulty, the equipment, me doing something incorrectly, or for some other reason. Once I figured out it was actually uniform, I took a huge breath of friendly, knowledge-sound, fresh air.
The main error in our experiment, though it doesn’t pertain to our actual findings in a way that noticeably affected it, but would have affected what we were going for, was the heater in my room. I talked to Alex Lockwood’s dad about it and he said that the heat in rooms the battery is in, especially when it changes a lot, can cause a battery to discharge at very different speeds. There was also the noticeable error caused by those times when I accidentally bumped or touched our set-up while it was recording (you can see it in single, really random, spiking/plummeting lines). Other, more adverse error can be found when I (Evan) had to prematurely cut two of our trials short because I had to leave and required my computer where I was going or had to take our set-up with me, such as when I was collecting data on the last day as an equipment test.
What I feel would be a good follow-up to this experiment would be finding the models of other batteries, such as regular alkaline batteries, Nickel-Cadmium, and Lithium-ion batteries. It’d be interesting to know if they all follow a quadratic model or if they really do what I assume most people think as them decaying exponentially.
If I were to redo this experiment, I’d try to decrease the load as much as possible in order to raise the rate of discharge. Alex Lockwood suggesting trying to short circuit the battery so that it would pull out much more than it is normally capable of, thus making it run dry much faster and making testing it much easier.
[1] Lund Instrument Engineering Inc. “Battery FAQ” <http://www.powerstream.com/BatteryFAQ.html> Orem, Utah.
-Explained the chemistry behind batteries as well as the jargon for batteries.
[2] EPA. “Products Stewardship” <http://www.epa.gov/epawaste/partnerships/stewardship/index.htm>
-Told me what to do with dead batteries, not really that helpful.
[3] CandlePowerForums. “NiMh Battery Shoot Out” <http://www.candlepowerforums.com/vb/showthread.php?t=79302>
-Helped us realize a potential model for batteries and that our data actually wasn't irregular.
[4] Stefanv.com. “Choosing and Using a Ni-MH Battery” <http://www.panasonic.com/industrial/battery/oem/chem/nicmet/index.html>
-Helped us decide on which battery to use and why.