Relationship
Between Electric
Power and Heat
By Jake Ralston
Discussion…….………………………………………Page 4
Bibliography…………………………………………………………Page 5
Related Sites.........................................Page 5
Description of Question:
I am measuring the relationship between power and heat. I will do this by flowing an electric current through a coil in a tube. I will measure the power that's flowing into the tube by measuring the current and voltage. P=IV. I will measure the temperature, in Celsius, in the tube using a thermocouple, where one end will be out in open air at room temperature and the other in the tube. I can then relate the temperature in the tube to the amount of power that's flowing into it accurately, and find out what type of relationship it is.
Background Information:
I know that heat dissipates through open air because it has unlimited room to travel. I know that the hotter the air, the more energy it takes to further increase the temperature. Below is information about the specific heat of air at its corresponding temperature (engineeringtoolbox.com)
|
temp of air ( C ) |
specific heat capacity |
|
0 20 40 60 80 100 120 140 160 180 200 250 300 350 400 |
1.005 1.005 1.005 1.009 1.009 1.009 1.013 1.013 1.017 1.022 1.026 1.034 1.047 1.055 1.068 |
As easily seen, the hotter the air gets, the more energy it needs to heat by the same amount as before, although not by a substantial amount.
I also know that the standard outlets I will be using to power my experiment run an alternating current at 3.33 Amps with 120 Volts. This means the outlets put out 400W because of the equation P=IV (shopwiki.com). Thus, 400 Watts will be the "limit" of power the transformer will be able to draw, which should almost undeniably be plenty.
Hypothesis:
I predict that after a certain amount of power, the temperature will peak. I believe this because I think the small glass tube that I will be using will only be able to retain so much heat, and after it is saturated, the rest will dissipate through the glass or ends of the tube into the air. I believe that before it reaches this point, however, that the temperature will rise at a near linear relationship, but flattening out as it approaches its saturation point. I have no prediction on what this saturation point will be.
1
The tools my experiment required were the following: an electrical transformer, a thermocouple, a glass tube, a metal coil that fit inside the tube, two accurate, digital gauges that measured amperes and volts, a computer to read the data from the thermocouple, and all the appropriate cables to connect it all together. The picture is of what it looked like.
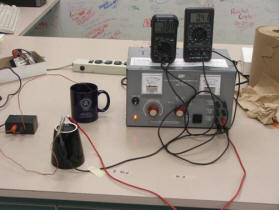 |
The transformer, the large gray box, was connected to a standard outlet (120ACV). It ran electric power through the red wire and the black wire parallel to it, both connected each end of the coil in the tube and used to run the electric power into it. The tube is on top of a ceramic cup turned upside down in order to keep it parallel with the ground. Otherwise, the wires would prop it up making it not parallel. The two digital gauges on top of the box read the amount of Voltage and Current that were flowing through the coil in the tube. The one on the left read Volts, the right read Amps. The thermocouple is the small black box at the left of the picture. It had two wires coming out of it that read the difference of temperature between them. One was put inside the tube, the other out in open air. This picture shows it when the other end was in a cup of ice water. I had initially planned to put it in ice water so that the difference in temperature would virtually be what the temperature was in the tube. I changed my mind to putting it out in open air because then the temperature difference would be the amount of temperature increase the system performed. In other words, room temperature wouldn't be calculated in the results. The thermocouple was connected to a computer that recorded the temperature data from the thermocouple when the experiment was running.
2
The computer screen then displayed the temperature information that I recorded.
I chose to set my experiment up like this because my goal was to find the relationship between electrical power and temperature. This set-up allowed me to easily run power into a tube and record the temperature produced as a result of that power. The gauges let me accurately know how the power was composed - amount of Voltage and Current - and let me accurately adjust how much was going into the tube. A thermocouple was chose because it accurately measures the amount of temperature increase the system caused because it compares it to room temperature. It was the simplest, most efficient set-up for answering the question I could think of using.
I started out running my experiment at .20 Amps. That means .20 amps were running through the wire initially. I then recorded the amount of Volts the digital gauge read at that Current. I waited for the temperature in the tube to peak then recorded that peak temperature. I raised the current by .20 Amps to .40 Amps. I recorded the Voltage next then waited for the temperature to peak again before raising it by another .20 Amps. I repeated this process until I got to 2.6 Amps, which was when it started smelling like something was burning causing me to stop.
Finally, I multiplied the corresponding voltages and currents to find the amount of power that produced the temperature.
Uncertainty:
![]() V= +/- 5% of actual
Voltage
V= +/- 5% of actual
Voltage
![]() I= +/- 5% of
actual Current
I= +/- 5% of
actual Current
![]()
P= +/- (1.05I)(1.05V)-(.95I)(.95V)
2
![]() T= +/- 10% of
actual temperature
T= +/- 10% of
actual temperature
A graph that includes the range of uncertainty is shown on the next page. The middle, blue line shows the actual calculated data. The pink line shows the highest Temp/Power ratio estimated possible. The yellow line shows the lowest estimated possible.
Power (Watts)
Temperature ©
0 23
2 74
3.5 121
5.6 139
8.1 196
11.2 240
13.8 288
16 320
21.7 380
25 421
32 463
33 501
3
I calculated the highest temp/power ratio I estimated possible by graphing the highest temperatures in the uncertainty range in respect to the lowest power in the uncertainty range. This yields the steepest graph possible because it divides the highest y-values by the lowest x-values, thus maximizing the temp/power ratio estimated possible. To graph the lowest temp/power ratio estimated possible, I graphed the lowest temperatures in the uncertainty range in respect to the highest wattage in the uncertainty range. This yields the flattest graph with the lowest power/temp ratio because it divides the lowest y-values estimated possible by the highest x-values estimated possible. The true data should lie somewhere between the yellow and pink lines, predictably nearest to the middle around the blue line.
The research semi-supported my hypothesis, but the evidence shows I was more wrong than right. This is because of two reasons. One, I predicted the temperature would rise at a linear rate until it reached its saturation point of energy. It did rise nearly linearly (I
4
know that's a pun), but not quite.
The second reason it was more wrong than right was because I predicted the slope of the graph would approach zero as the tube reached its point of saturation. I never reached the point of the tube's saturation of heat to be sure of this.
What was most interesting is that the slope of the graph seems to resemble the specific heat capacities of different temperatures of air listed on page one. The slope steadily decreases faster at some exponential rate as the power increases just as the specific heat capacity steadily rises at some exponential rate as the heat of the air increases. I'm sure more heat was being lost through the system as the power increased, but since the system was able to handle so much heat, I believe the specific heat capacity of air played near an equally critical role in lowering the temp/power ratio as the power increased. I was unable to figure out an equation for what rate the graph decreases. I tried everything I could with a TI graphing calculator, but no solution it came up with was accurate enough.
I would recommend using a system more capable of handling a higher heat for future researchers. That would yield more accurate data of how a system like the one I used acts around its saturation point of heat.
The most significant error in this is experiment, I think, is the fact that a wire will get hotter the more current it has. This means that if you put the same amount of power into the wire in two different ways, the wire's temperature will be significantly different. Way one is to have a low voltage and high current. Way two is to have a high voltage and low current. Both yield the same power, but one the former increases heat at a much higher rate. There are infinite combinations of current and voltage that amount to the same power, meaning there are infinite equations relating the heat to power. Other errors could include miscalculation of uncertainty and the placement of the thermocouple's end in the tube being less than ideal.
Information on the specific heat capacity of air - engineeringtoolbox.com
Information on power output of a standard outlet - shopwiki.com
wikipedia - Wikipedia. General information on heat dissipation.
engineeringtoolbox.com - More information on heat dissipation, including the specific heat capacity of specific materials
shopwiki.com - Products designed for maintaining heat dissipation
westernextralite.com - Includes a similar graph of power vs. heat
hoffmanonline.com - More information on heat dissipation