The Science of Wheeled Energy
By
Jeremy Johnson,
Brock Tillotson, Cally Kamiya
Background Information Statement of Problem
Review of Literature Hypothesis
Method Results Uncertainty
Discussion
Sources
Return to Research Page
Background information: TOP
While a hot wheels car is obviously intended for youthful entertainment, it can be a useful teacher of fundamental physics concepts and their application to the real world. An easy way to see these concepts is when the car is placed at the top of a ramp and expected values of energy and velocity are compared with measured values. In a perfect situation “all the kinetic energy would be translational and you would expect its velocity to be calculable by equating the kinetic energy to the original potential energy” (Brown). But a perfect situation is not available, rather, other forces are at work in this experiment. Most notable of these is friction, but rolling wheels have a different friction (Davidson), since the wheels are both sliding and rolling across the surface of the ramp. Also, wind resistance plays a part in the reduction of velocity. ˝(mv2)
Statement of Problem: TOP
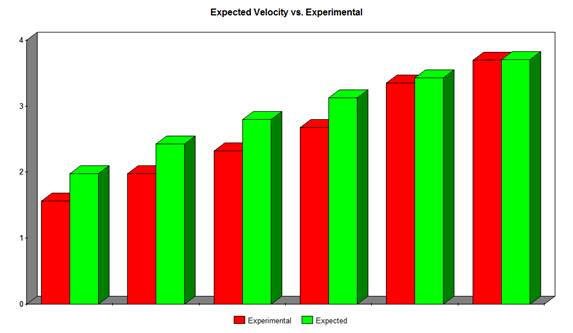
The purpose of this experiment is to compare the expected exit velocity of the car as it leaves the bottom of the ramp, expressed by the potential energy, with the actual measured kinetic energy and velocity of the car at the end of the ramp.
Review of Literature: TOP
There are very many factors that go into determining the energy that the car will retain at the bottom track for kinetic energy, such as wind resistance, friction, and other aspects like the straightness and conformity of the wheels and the track. Since the car is not simply sliding down the ramp, but using its wheels to roll, it complicates the process. “Assuming that a wheel is rolling without slipping, the surface friction does no work against the motion of the wheel and no energy is lost at that point” (Hyper). In this case, “all the kinetic energy would be translational and you would expect its velocity to be calculable by equating the kinetic energy to the original potential energy” (Brown). But the real answer is in the middle, and this is called rolling friction. A equation that takes this into account is the normal friction divided by the radius of the wheel times the normal force (Davidson). Overall, keeping the variables of weight, surface materials, and height/material of the ramp constant will be the most important. However, we do not expect the rolling friction to differ very much from height to height, as wind resistance would. According to Huntley, the force of wind resistance is equal to the product of the density of air, the velocity of the object squared, the reference area, and the drag coefficient (Huntley). Therefore, as the ramp height increases, so too should the force of wind.
Hypothesis: TOP
If the height of the ramp is raised then the percent of potential energy not resulting in kinetic energy will increase because of increased drag due to wind resistance.
Method: TOP
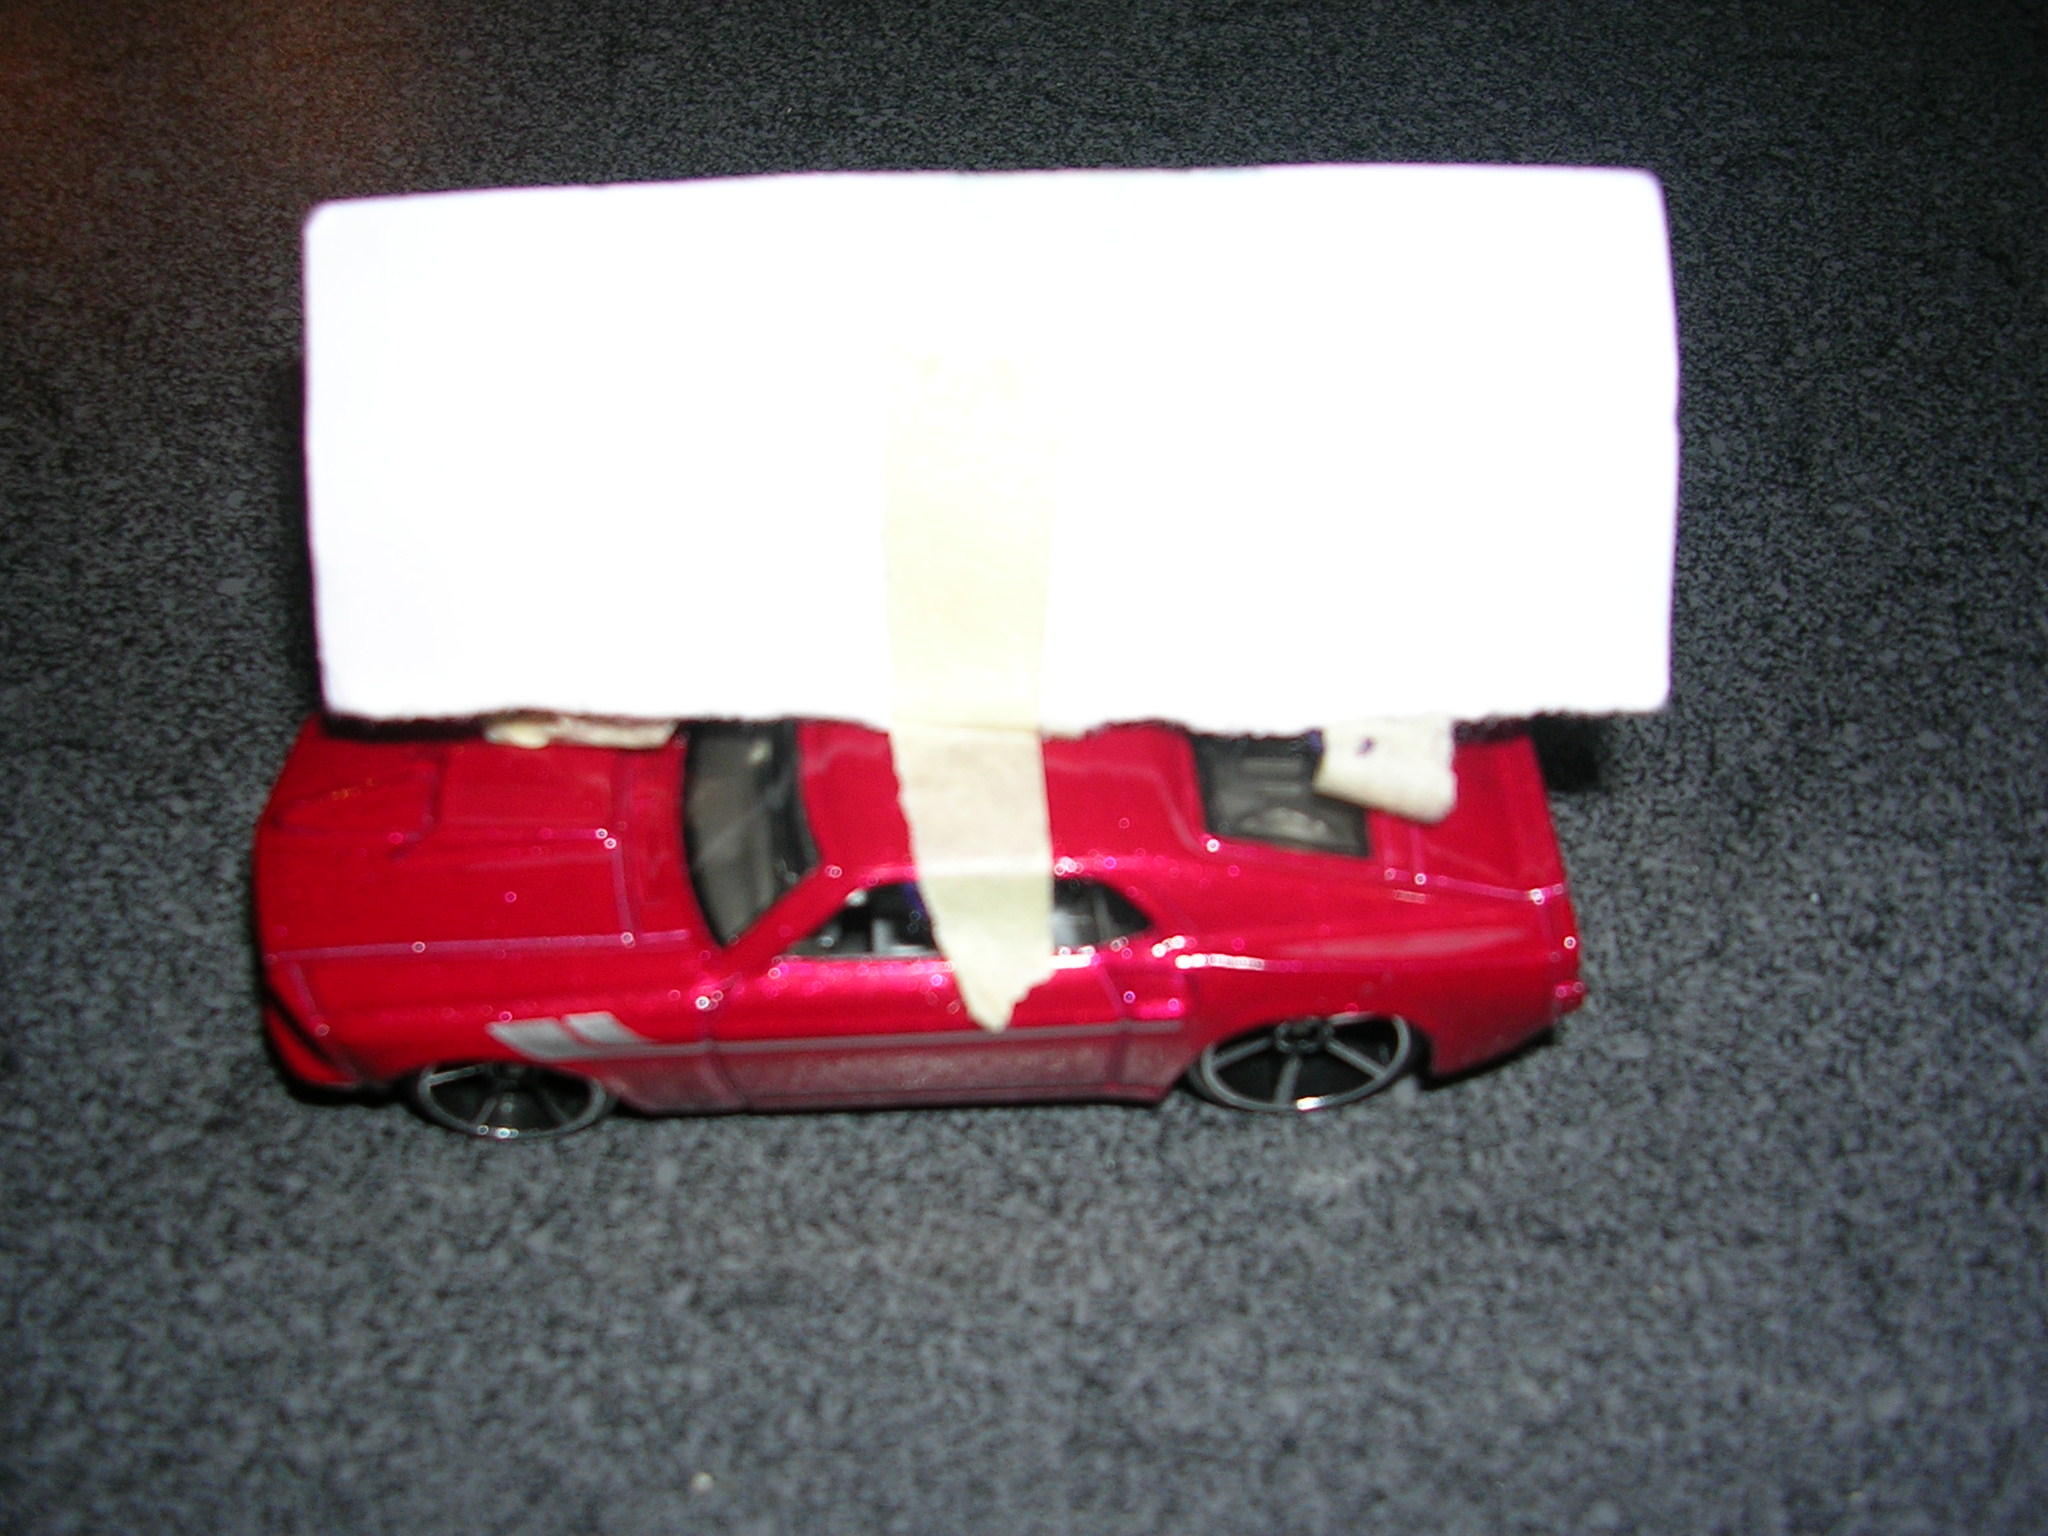
In our experiment, we set up a ramp in order to find results, hopefully, the same as what we hypothesized. We used a six foot long, orange Hot Wheels ramp. The ramp was set up as the hypotenuse of a right triangle with the other two sides of the triangle being the floor and the wall. We kept the track rigid with yard sticks in order to keep it in a straight line. At the very bottom of the track, there was a speed trap, or photo gate, to measure the instantaneous velocity of the Hot Wheels car. We changed the height of the ramp in intervals of ten centimeters starting 20 cm and going to 70 cm. At each interval, we measured the velocity of the car ten times using Logger Pro program. In order to measure accurately, we had to attach an index card of exactly .078 m to the top of the car with masking tape. After that, we entered all the data into an excel spread sheet.
We set the ramp up straight to make sure that the calculated velocity was accurate. The speed gates were position directly where the ramp
touched the ground, at the point of zero decline, so that no energy was lost.
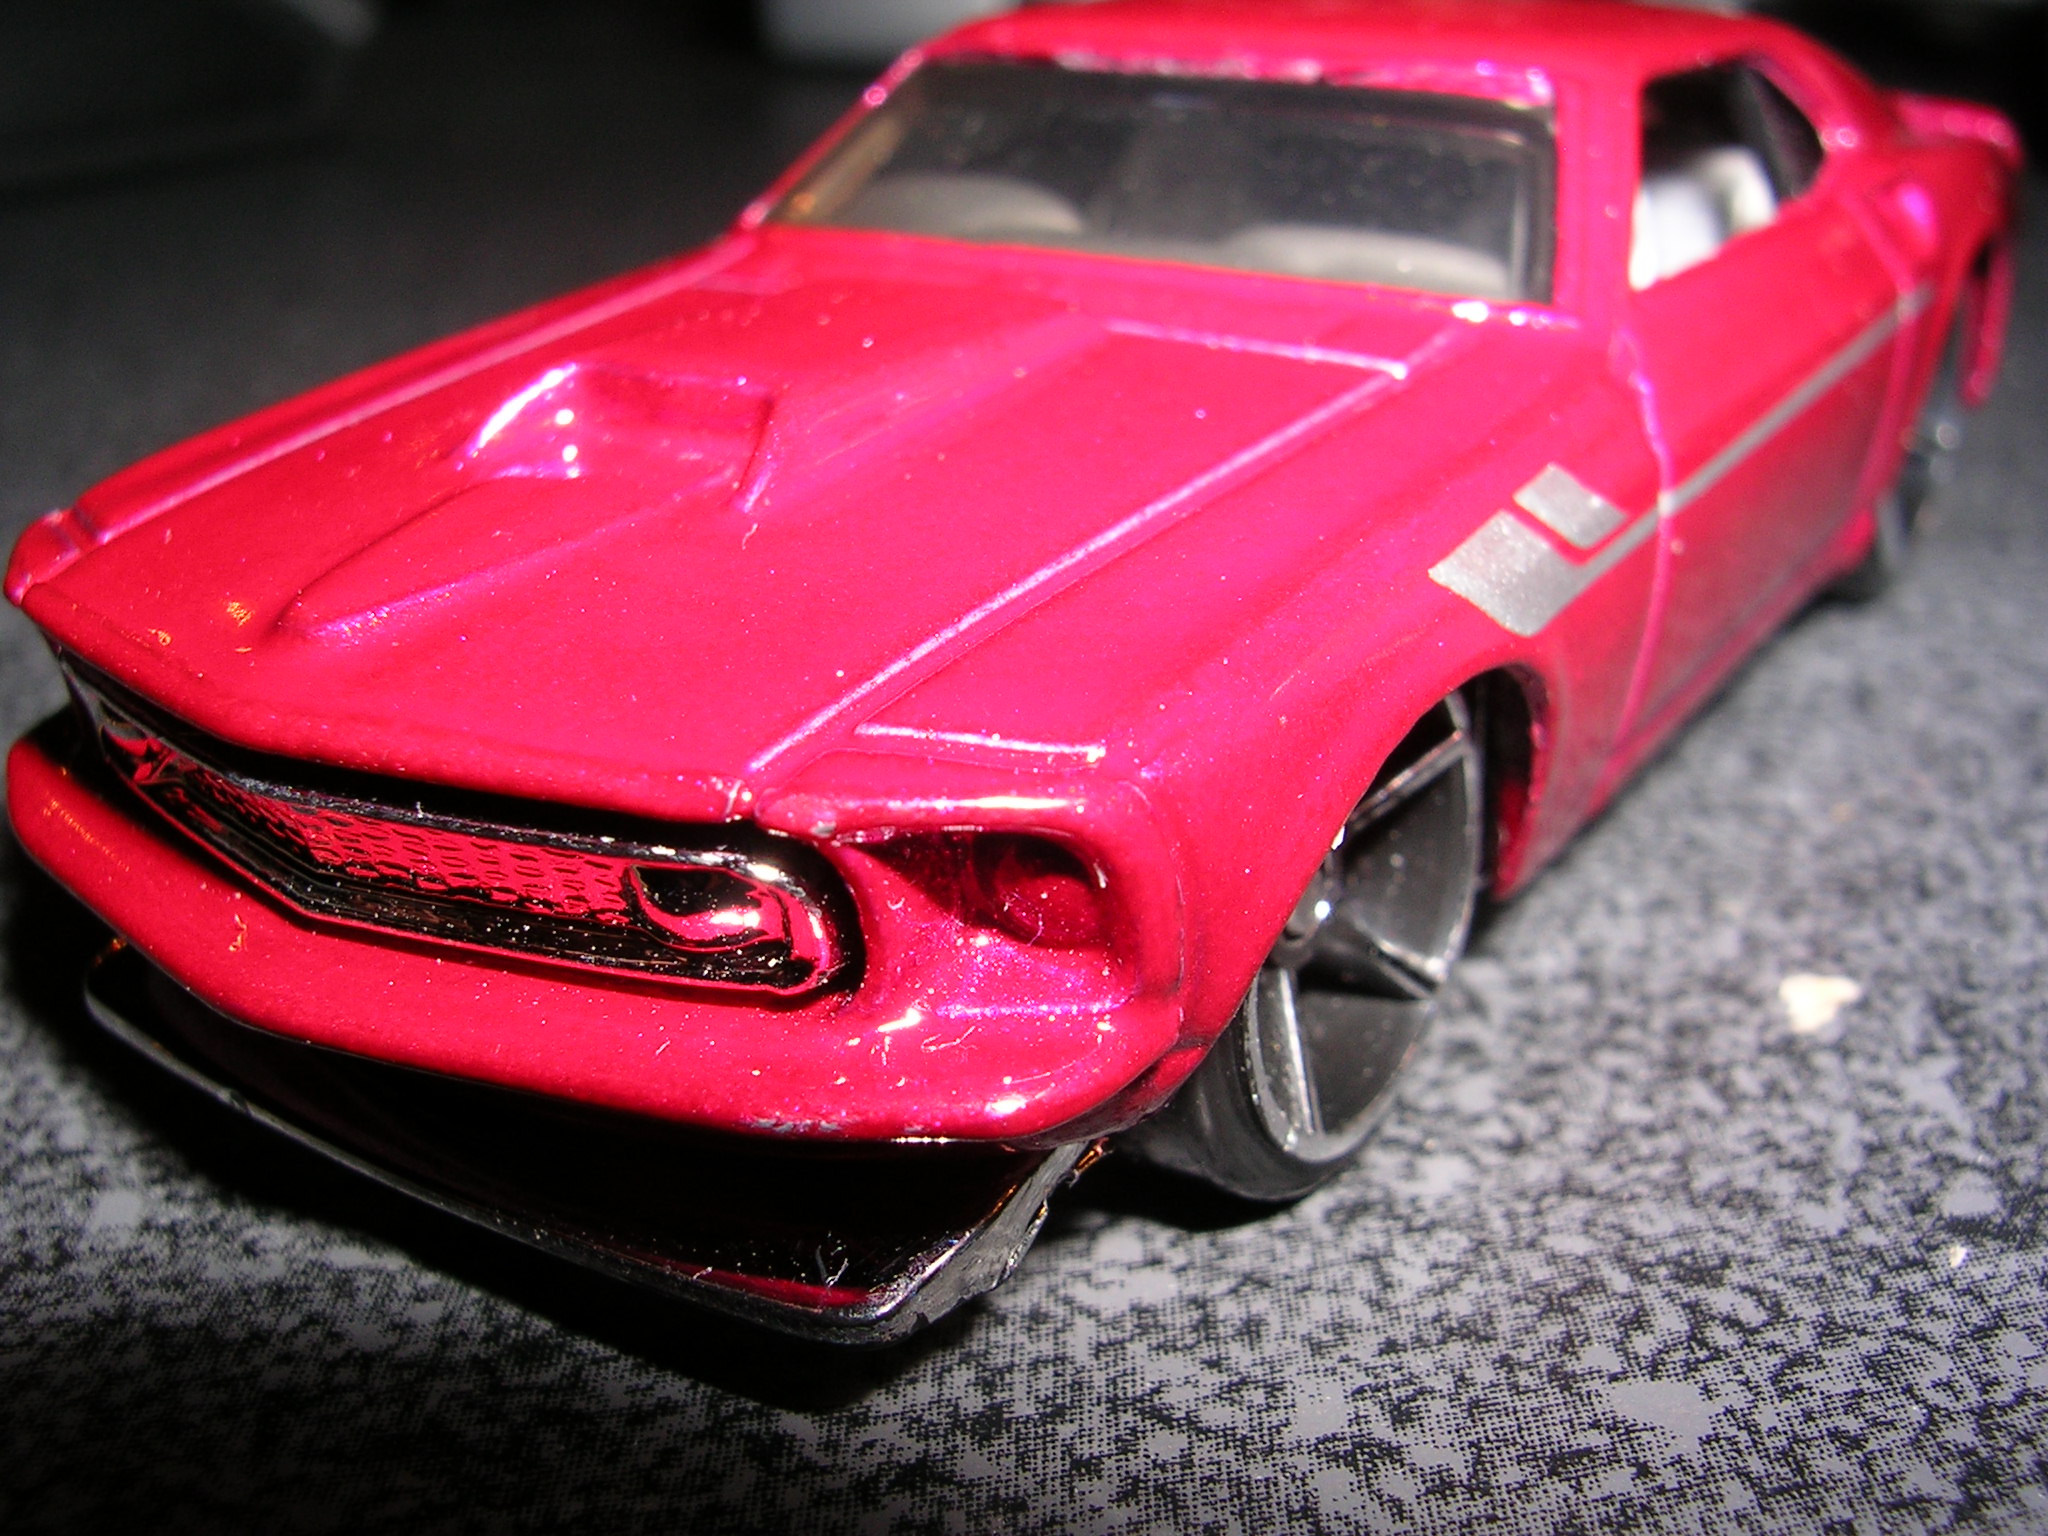
| 1969 Ford Mustang Mach 1 |
Car with index card attached |
|
|
|
Results: TOP
![]()
![]()
![]()
![]()
Raw Data (Text - tab delimited)
Uncertainty: TOP
There are several sources of uncertainty in our project, starting with the apparatus. The ramp was slightly curved at the end which may have slowed the car down minimally. Additionally, where the pieces of the ramp connected there were grooves which may have also slowed the velocity of the car. The photo gate measured an average velocity over a very short period of time while the car passed through it; therefore, the velocity was not entirely instantaneous and so not entirely accurate. However, the amount of error resulting from the photo gate is relatively inexistent. Through the course of our experiment the friction on car’s wheels, either from the axels or the track, may have may have lessened, thus increasing the velocity of the car and, consequently, the kinetic energy. The height of the track was accurate to within 5mm.
Discussion: TOP
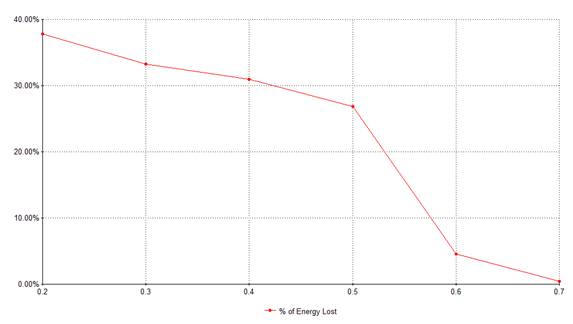
After experimenting numerous times on a variety of ramp heights we concluded that our hypothesis, that if the height of the ramp is raised then the percent of potential energy not resulting in kinetic energy will increase drag due to wind resistance, was incorrect. However, it turns out that the percent of energy lost does directly correspond to the height of the ramp. In fact, our hypothesis was exactly opposite from what our data indicates. This means that if you keep all variables constant but increase the height of the ramp, then the percentage of potential energy not converted into kinetic energy will decrease. Our prior hypothesis was based on the assumption that the force of drag slowing the car down would increase as the height of the ramp and therefore the velocity or the car increased. While this is true, the difference between wind resistances among the different heights was not significant enough to greatly influence the data.
Further research could be conducted regarding the effect that the height of the ramp and the velocity of the car has on the friction between the car and the ramp. Because the car is wheeled, rolling friction must be accounted for and therefore the height of the ramp might affect the amount of time the car spends sliding, as opposed to rolling, along the surface. Our hypothesis is that the car would spend less time sliding as the height of the track is increased. This would explain why the amount of energy lost decreases as the height of the track increases.
Source 1- This
website gives a brief introduction to the extremely complex world of wind
resistance. It also discusses slopes and gravity’s effect on speed of a vehicle.
Source 2- In
this section of Davidson University’s physics website, the phenomenon of rolling
friction is discussed. Rolling friction is important to the physics of car
movement, since it governs all wheel movement.
Source 3- This
site is dedicated to the physics of the pinewood derby, which is very similar to
our project. If offers a few alternative ways to look at it, and is a great
leaping off point if you’re looking for more in the ways of our project.
Source 4- If
you are interested in how friction affects movement and speed, definitely go to
this website. It has a great overview of static, kinetic, and rolling friction
is understandable but sophisticated language.
Source 5-Another
hyper physics website, this one goes into more depth with the physics of a tire
and the things necessary to create movement.
Website created by Jeremy Johnson, 6/1/08