
By Molly Winterrowd and Cara Druse
Introduction Materials Procedure Data Data Analysis Discussion Bibliography Return to Research
By Molly Winterrowd and Cara Druse
Introduction Materials
Procedure
Data Data
Analysis Discussion
Bibliography Return to
Research
Introduction .:. Top
Background Information:
Although the history of soccer seems to be vague, its earliest mention is a Chinese game called “tsu chu.” The game, which was played in 2500 BC, involved kicking a ball made of animal skin “through a gap in net stretched between poles 30 feet high” [1]. Variations of this game continued to be played in the Ts’in Dynasty and the Han Dynasty to train soldiers. Furthermore, Pacific Islanders played games with their hands and feet, the Eskimos played “aqsaqtuk” (essentially soccer on ice), and the Indians played a similar game on beaches. However, “it was in England that soccer/football really began to take shape” [2]. It was in 1863 that the first football association was formed in England and fundamental soccer rules were implemented. The first international match was played in 1872 between England and Scotland, after which the games popularity continued to grow rapidly.
Today, soccer games are played on a field that is marked to designate various boundaries. Two common areas from which the ball is shot are the goal area and the penalty line. The goal area is marked “5.5 m from the inside of each goal post” and the penalty line is “16.5 m from the line of each goal post” [3]. A goal, which is worth one point, is scored when the ball passes over the goal line; however, because of many variables acting on the ball, it can be difficult to score.
Statement of the Question:
The purpose of this experiment is to find the relationship, if any, between the angle at which a soccer ball approaches its target (independent variable) and the distance at which the ball is kicked (dependent variable).
Review of Literature:
In order to investigate the effect of distance on the angle at which a soccer ball approaches its target, we must understand other influential variables. These variables include the balls initial velocity, spin, drag force, lift force, and point of contact. Air flow, which causes “lateral deflection” of the ball while its in the air, “is generally known as the ‘Magnus effect’” [4]. This occurs because the air travels faster against the side of the ball moving with the air flow than it does on the opposite side, which opposes air flow. According to Bernoulli’s principle, this “increases in velocity occurs simultaneously with the increase in pressure” [5]. Furthermore, the forces on the ball can cause the ball to avert from its straight path. A ball spinning through air is affected by two main forces: a lift force and a drag force. “The lift force is the upwards or sideways force that is responsible for the Magnus Effect. The drag force acts in the opposite direction of the path of the ball,” causing the ball to veer to the side [4]. The slower the ball’s velocity, the more the ball is deflected as a result of these forces; this is why the ball usually curves at the end of its flight, when its velocity is lowest. The actual distance a ball travels is also affected by air resistance, which causes the “range in reality to be much shorter” than predicted by calculations “in which the air resistance is neglected… and the trajectory becomes a parabola” [6]. We will not be including air resistance in our calculations and will need to take this into consideration when calculating the uncertainty of our results. Finally, experiments have been conducted to examine the effects of the ball’s point of impact. “The initial experiment proved what most footballers know: if you strike the ball straight on with your instep so that the foot hits the ball inline with the ball’s center of gravity, then the ball shoots off in a straight line. However, if you kick the ball with the front of your foot with the angle between your leg and foot at 90 degrees, it will curve in flight” [4]. This is because the applied force gives the ball a spin, giving the drag and lift forces a greater effect on the ball. The fact that these forces cause the ball’s movement to shift at the end of its flight, suggest that the angle at which the ball approaches its target is a variable worth exploring when attempting to find the most accurate shot.
Hypothesis:
If the ball’s launch distance (independent variable), defined as the distance from the target at which the ball is kicked, increases, then the angle at which the soccer ball approaches its target (dependent variable), which will be measured in degrees, will decrease.
Materials .:.
Top
· Soccer ball
· Digital camcorder
· Tripod
· Mini DV Cassette
· Meter stick
· Butcher paper (to make target)
· Tape
· Computer
· iMovie software
· Blank CD
· Logger Pro software
Procedure .:.
Top
1. Set up
· Construct a .6 meters by .6 meters target using the butcher paper.
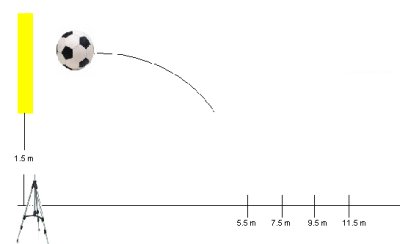
· Tape target to the wall 1.5 meters above the ground.
· Set the camcorder perpendicular to the target at a height which captures the soccer ball as it approaches the target (the kicker and the entire path of the ball do not need to be recorded).
· Measure and mark (with tape) distances 5.5 meters, 7.5 meters, 9.5 meters, and 11.5 meters from the target.
2. Press record on the digital camcorder.
3. Palce the ball on the 5.5 meter line and launch the soccer ball at the target.
4. Repeat step 3 until the ball has successfully hit the target 20 times.
5. Place the ball on the 7.5 meter line and launch the soccer ball at the target.
6. Repeat step 5 until the ball has successfully hit the target 20 times.
7. Place the ball on the 9.5 meter line and launch the soccer ball at the target.
8. Repeat step 7 until the ball has successfully hit the target 20 times.
9. Place the ball on the 11.5 meter line and launch the soccer ball at the target.
10. Repeat step 9 until the ball has successfully hit the target 20 times.
11. After collecting the data, transfer the video footage to a CD using iMovie.
12. Open the iMovie in Logger Pro.
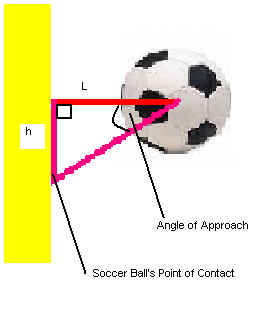
13. Use Logger Pro video analysis to trace the path of the ball.
14. Using the ball’s path as a guide, calculate the ball’s angle of approach using the following equation:
Angle of Approach= tan^-1(h/L)
· H is height
· L is length
Data .:. Top
Data File (text tab
delimited)
Data Analysis .:. Top
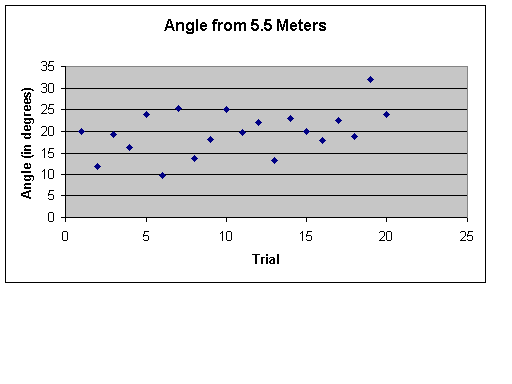
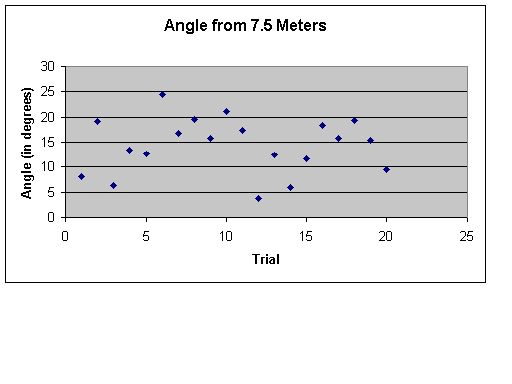
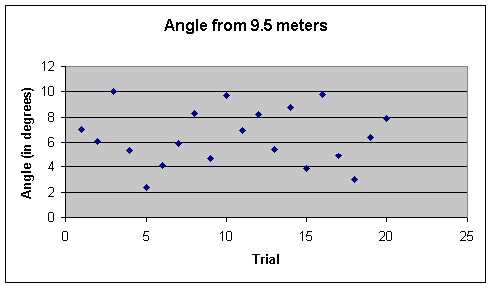
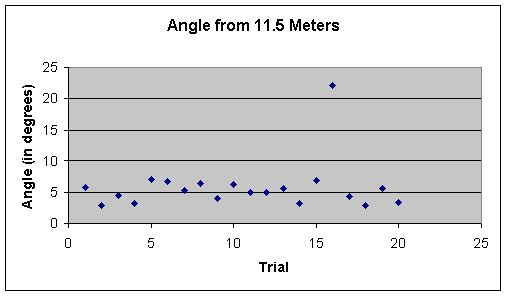
The data from the 5.5 meter launch distance and the data from the 7.5 meter launch distance show a wide range of angles hitting the target. However, we also see that although there is a range of 9.67 degrees to 31.91 degrees (a difference of 22.24 degrees) for the 5.5 meter launch distance, this range decreases slightly to a range of 3.7 degrees to 24.52 degrees (a difference of 20.02 degrees) in the 7.5 meter trial. This range drops dramatically at the 9.5 meter launch distance, where the angle of approach ranges from 2.39 degrees to 10.01 degrees (a difference of only 7.62 degrees). This trend continues to be present in the 11.5 meter launch distance, where, excluding the outlier of a 22.2 degrees, the angle of approach rangers from 2.89 degrees to 7.00 degrees (a difference of 4.11 degrees). These data are consistent with our hypothesis.
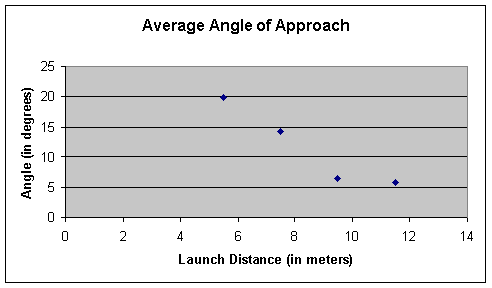
The above graph illustrates how the average angle of approach is affected by launch distance. The angle of approach decreases substantially at first, and then the rate of change decreases, and the graph begins to level off.
Uncertainty:
It is important to consider the following sources of uncertainty when evaluating our hypothesis. Some kicks were difficult to trance on Logger Pro because of blurry footage or dark areas in the frame. Human error may have also caused inaccuracies in our data. Our measurements could be off, or we could have transferred an inconsistent force to the ball because we did not us a mechanical “kicker.”
Discussion .:.
Top
Overall, the data supports our hypothesis. Although the angles of approach vary significantly within each launch distance, the ranges of approaching angles consistently decrease with increased distance, and an inverse relationship is clear. This suggests that from a shorter distance, a soccer player is more likely to shot or pass accurately despite the ball’s angle of approach; however, as distance increases, difficulty increases, and the ball must approach the target at a very small angle.
Although our results are strong, our experiment could be improved in several ways. First, if we were to re-do the experiment, we could conduct more trials from a greater number of distances. By having data from a greater number of distances, we would ensure a more accurate conclusion. Also, when doing research for this experiment, we found out that an Adidas facility in Germany uses a robotic leg in their testing process. If we were to use a similar leg following our same procedures, we would be able to better control some of the variables (force, velocity, etc.). It would be interesting to see how these changes would affect our results.
Bibliography .:.
Top
[1] The Oracle Education Foundation. “The History of Soccer.” 1999. http://library.thinkquest.org/6314/history.html - Find out about this history of soccer!
[2] “Soccer History and Information.” 2005-2006. http://www.all-soccer-info.com -Interested in soccer history, the Football Association, and countries in which soccer is played--click here!
[3] Gary and Bonnie Blank and Engineering Update Institute. “The Official Soccer Website.” 1998-2002. http://www.drblank.com/slaws.htm -This site describes the fields dimensions, rules, and other information any soccer player should know!
[4] “The Physics of Football.” Physics World Magazine. June 1998. 25-27. http://www.soccerworld.com/Physics.htm#Atricle1 -Search for soccer training (strengthening skills), physics involved with soccer, and other fitness information.
[5] Free Software Foundation, Inc.. “Bernoulli’s Principle.” 2000-2002 http://en.wikipedia.org/wiki/Bernoulli%27s_Principle -Discover Bernoulli's Principle, which explains the ball's path due to various forces.
[6] “The Math and Physics of Soccer.” 2001. http://oceansiderevolution.com/EINSTEIN.HTM-Everything you could possibly want to know about the physics of soccer.