
IB Physics
An Inquiry into the Flow Rates of Water
Brian Luscombe, Isaac Wilcott, and Kyle Knudsen
Physics presents itself daily in our society. Oftentimes people overlook the applications of physics that can be witnessed in our daily life. Physics can be applied to every facet of life, ranging from the intricate functioning of birds flying, to the rhythmic beat of waves upon a beach. Research on fluids has proved to be a very fruitful and intriguing topic within the field of physics. Because fluids and especially water are so loosely bound on the molecular level, it results in motion that is extremely kinetic and uniform in relation to the laws of physics. An important formula that will be used in the course of our experiment is Toricelli’s law, which states that there “is a mathematical relationship between the flow rate of a fluid from a draining tank and the height of the fluid in the tank” (Gershwin 1). The formula is derived by taking into account the surface area of the tank, the volume of the tank, cross-sectional area at exit, and the pressure in the bottom of the tank. Once the formula has been derived it turns out that “the rate of change of volume of fluid in a draining tank is proportional to the square root of the depth of the fluid in the tank.” One must also be familiar with the laws of linear kinematics in order to fully understand this experiment. Specifically, the role that gravity will play in this experiment because of the fact that the water from the holes will be affected by the gravitational force, which is 9.8 m/s.
The purpose of this experiment is to find the relationship between the displacement of water from a small opening in a container, and the height of the hole in relation to the water level in the container. We will use the distance that the water travels from the hole in order to prove Toricelli’s Law.
Based upon the theories of Physics we believe that the bottom hole will have the greatest amount of pressure and therefore have the highest flow rate velocity from the hole. Conversely, the highest hole will have the least amount of pressure and therefore will have the lowest flow rate velocity. However, we believe that our experiment will not follow Toricelli’s theory perfectly due to various factors such as the friction that the holes will provide. After all, Toricelli’s law is an example of an ideal situation, while our experiment is more practical. This being said, we still believe that we will still be able to find enough conclusive evidence to support Toricelli’s Law.
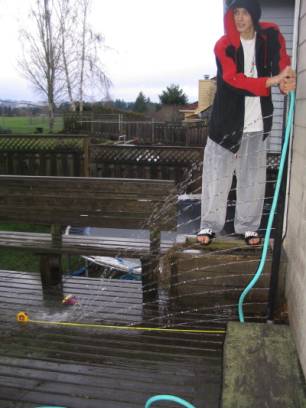
Our experimental setup started off with a piece of black plumber’s pipe that was 10 feet long and 2 inches in diameter. The pipe was a little to lengthy to begin with so we decided to cut the pipe in half so it would be more manageable for our experiment. After cutting the pipe, the final measurement of length was 5 feet, or 60 inches. Our experiment required us to drill a certain amount of evenly spaced holes into the side of the pipe, so we calculated that if we drill a hole every 4 inches starting from the bottom, we will be able to have 14 different data points all at different heights. 60 divided by 4 is 15, but the 15th hole would have been at the very top of the pipe, so we decided to not use it as a data point. The diameter of the drill bit and the size of the holes in the pipe were 5 millimeters each. If the holes were to be too big, it would be hard to constantly fill the pipe with water because too much water would be exiting the holes. On the other hand, if the holes were too small, the pipe might overflow and not enough water would come out to record any data. We tested a hole at 5 millimeter in diameter and decided it was a decent size for our experiment. To make sure that no water escaped out the bottom end of the pipe, we used a layer of clear plastic wrap with several layers of duck tape to secure the bottom. Now that the preparation of the pipe was finished, we began the experiment. We took a normal hose that was connected to an outside water faucet and put the hose far enough down the pipe that the water wouldn’t spray out the top. The pipe started to fill up and the experiment was looking great until that water stopped at hole 8. We figured that more water was exiting the holes at the bottom then the amount of water the one hose was supplying. We fixed the problem by getting another hose, just like the previous one, and putting both hoses down the pipe at the same time. All 14 holes filled up and our experiment was working. The process of gathering data was simple. We had a measuring tape laid out in the direct path of the all the water streams. One person was keeping the pipe straight and sturdy, another person was reading the distance of all 14 streams, and the final person was recording the distances on a piece of paper. We kept the hoses constantly running and the holes constantly emitting water until all data was collected.
Diagrams of experimental setup:
|
Holes |
Inches from bottom |
Distance Water Traveled (Inches) |
Flow Rate Velocity (m/s) |
|
|
1 |
4 |
32 |
5.65 |
|
|
2 |
8 |
40.5 |
5.05 |
|
|
3 |
12 |
48 |
4.89 |
|
|
4 |
16 |
51 |
4.49 |
|
|
5 |
20 |
53 |
4.18 |
|
|
6 |
24 |
54.5 |
3.92 |
|
|
7 |
28 |
59.25 |
3.95 |
|
|
8 |
32 |
57.75 |
3.6 |
|
|
9 |
36 |
56 |
3.29 |
|
|
10 |
40 |
55 |
3.07 |
|
|
11 |
44 |
51.5 |
2.74 |
|
|
12 |
48 |
48.5 |
2.47 |
|
|
13 |
52 |
40 |
1.96 |
|
|
14 |
56 |
33 |
1.55 |
|
We used the data of the distances from the ground that the holes were, as well as the distance that the water traveled in order to calculate the flow rate velocity from each of the holes. This was accomplished by using the theories of linear kinematics. We first used the vertical height, acceleration (9.8 m/s) and initial velocity (0 m/s) and the equation of s = ut + 1/2 at2 in order to find the time that the water spent in the air. We then used the time accompanied with the horizontal distance covered and the same equation as above in order to find u (the initial velocity). This was our flow rate velocity. It is important to evaluate the level of uncertainty that also accompanies this experiment. Firstly, there were many errors that we encountered during the course of the experiment and many factors that may have contributed to the data being manipulated. One of the errors that we encountered was due to the fact that the holes are not in an ideal environment in which no friction is created between the water and the holes. Therefore, this friction will result in the data being slower than the ideal expectancy. Furthermore, due to the nature of the streams of water that we were measuring, we could only measure the streams accurate to the nearest quarter of an inch (which is equivalent to about .006m). This results in our experiment only being accurate to a certain degree. Also, another potential error was the interference that the water streams created within one another as they passed through or by each other. Perhaps this could have been avoided by skewing the streams at different angles from the pipe so that they would not have intersected. However, that might have introduced a new variable which we did not want. With all of this being said, the uncertainty can not be assessed a numerical value (due to the fact that some factors, such as the water stream interference, can not be numerically evaluated). However, it is still important to recognize that this experiment was not flawless and maintained a certain level of uncertainty.
Our hypothesis was that the bottom hole would have the most water pressure because of all the water on top of it, but it would have the least height to travel. The water would rush out more rapidly then any of the other holes, but would travel one of the shortest distances. On the other hand, we figured that the exact opposite would happen to the top hole. It would have the least amount of pressure because it’s at the very top, but it would have the most height to travel. Although the hole had the most height to travel, the water would slowly exit the pipe causing it to also have one of the shortest distances. After a good deal of thinking, we determined that either the 7th or 8th hole would have the greatest distance because it would be a combination of both the top and bottom hole. It would have an average amount of water pressure with an average height for the water to travel. After performing the experiment, our hypothesis was proven correct in that the lowest hole had the highest flow rate velocity as would be suggested by Toricelli’s law. Furthermore, the highest hole from the ground at the lowest flow rate velocity because of the small amount of pressure that it experienced. The subsequent holes followed a progression of having more pressure as the holes got closer to the ground. By looking at the graph, you can see that the top and bottom hole have the least distance and the middle hole has the most distance. Some suggestions for further research would be to calculate the water pressure entering the pipe from the hoses and also seeing if the diameter size of the holes would affect the distance the water would travel or maybe the height or diameter of the original pipe. Another variation to our experiment that might yield fruitful results would be to conduct a similar experiment to ours, except only one hole at a time. All the other holes would be plugged. This would be useful because it would eliminate the interference that the water experienced as it passed nearby streams of water. It would also result in slightly different data because of the fact that no water would be exiting the upper holes, and therefore there would a much stronger pressure on each of the holes.
Related Web Pages for Your Enjoyment:
Torricelli's Law- For all you math heads out there, this is an excellent site that breaks down Torricelli's law and its derivations and mathematical roots.
Torricelli's Law and Fluid Dynamics- Similar to the previous site, this website provides an excellent mathematical breakdown of Torricelli's Law. It also has further research on fluid dynamics.
http://www.ace.gatech.edu/experiments2/2413/torricelli/fall02/TorricelliLaw/analysis.htm
Gallery of Fluid Dynamics- So are you tired of all the math and science that has been thrown at you? Well, this website is a welcome break from scientific and mathematical analysis, yet is interesting and slightly educational. It is a website that contains galleries of photographs pertaining to fluid dynamics. Check it out, some are very aesthetically appealing, not to mention interesting.
http://www.fluidmech.net/gallery/
EFluids- A whole website devoted to experiments, problems, pictures, and links pertaining to fluids and science!!! What more could you ask for?
Torricelli Animation- An excellent visual animation of Torricelli's Law at work. Brought to you by Dartmouth University.
http://www.math.dartmouth.edu/~calcsite/Animation/TorricelliLaw/
Wikipedia- Although often discredited as a website where serious scholarly research can be done, this wikipedia page on fluid dynamics is still insightful, educational, and interesting.
http://en.wikipedia.org/wiki/Fluid_dynamics