Jessica Hadwin
IB Physics Research Project: Microwave Energy
Jessica Hadwin
Table of Contents
Introduction
Method
Results
Discussion
Bibliography/Related Sites
Return to research
Introduction Up
Background Information/Review of Literature:
Microwave energy offers a wide variety of industrial uses, ranging everywhere from detecting speeding cars to treating soreness in muscles (Michael Oudlaug). However, the average person most commonly utilizes microwave energy in the form of the domestic microwave oven.
The microwave oven was accidentally discovered through magnetron (vacuum tube) testing in 1946 by engineer Perry Spencer (Invention of the Microwave Oven). While testing he noticed that the candy bar in his pocket had melted, which prompted him to run more tests using the magnetron with other kinds of food. In this way Spencer discovered that food cooked at a faster rate when it was placed near the magnetron (Gallawa). He then constructed a metal box with an opening in which to feed microwave power. The energy entering the box was thus unable to escape, thereby creating a higher density electromagnetic field. The product went on to be introduced publicly in the 1950's.
Although most people know how to use them, very few understand how or why they work. Typically, microwave ovens operate at a power of 800 to 1000 Watts. Their operating frequency is 2458 MHz, while the peak operating voltage of the magnetron powering the machine is 4000 V DC (Fun Things to Do with Microwave Ovens). Microwaves are able to produce heat within the food by causing the water molecules to vibrate. Thus, foods with lower water content cook slower. Also, despite the fact that radiation is used to cook it, the food itself is not radioactive because as it absorbs the microwave it converts it to heat. However, though microwaves heat food quickly, they are unable to distribute the heat evenly without a rotating plate. This is because microwaves are a standing pattern of waves which, in turn, create hot spots (Beaty). Alistair Steyn-Ross and Alister Riddell demonstrated this idea when they heated Cobalt Chloride-soaked paper in a microwave oven. A pattern of color remained after the paper was placed in the microwave because the paper is pink when wet and blue when dry. The hot spots can usually be found at the halfway points of the waves which create a 3D pattern (Beaty). Thus, their experiment helped determine the location of the hot spots within a microwave.
Microwaves have a specific structure (as mentioned above) which includes peaks and troughs. However, when two waves pass through the same region at the same time interference occurs (Giancolli 33). There are two types of interference: constructive (greater displacement of amplitude and higher intensity) and destructive (reduced intensity). When the waves collide, uneven heating takes place. In places where the waves do not collide hot spots occur.
Statement of the Problem:
Due to the nature of waves it is understood that the heat distribution within a microwave oven is uneven. The purpose of this investigation is to attempt to find a specific pattern of heat distribution and, similarly, to deduce the 3D pattern that the waves in the microwave should create.
Hypothesis Up
The temperature of the water will vary depending on where in the microwave it is located. Because the instructions for a microwave suggest placing the food in the center, I would hypothesize that the hottest spot will be there.
Method Up
Materials:
1. Microwave oven
2. 100 ml beaker
3. Thermometer
4. White board pen
5. Ruler
6. Water
Procedure:
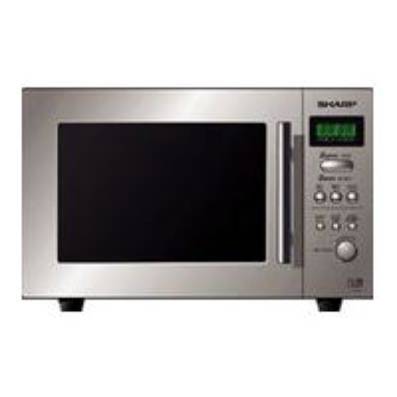
The first thing I did was remove the glass turntable inside my microwave. I did this because the turntable would make the heat distribute evenly, and thus defeat the purpose of this experiment. I then used the ruler and the white board pen to measure out 16 two by two inch squares, four squares long and four squares wide. I then filled the 100 ml beaker with 70 ml of water and let it sit for one hour in order to get to room temperature (around 20 degrees Celsius). After this I placed the beaker in one of the measured squares and micro waved it for 30 seconds and proceeded to take the final temperature. After recording the temperature of my first trial, I poured out the water I used and measured out another 70 ml of tap water. I let that sit for another hour to let it get to room temperature and to let the microwave return to room temperature as well. I repeated my procedure for all 16 squares, trying each square twice. The following is an aerial view of how I divided the microwave and a picture of the microwave I used.
Results
Up
Trial 1
Back of Microwave
37 34 37
33
35 50 39
49
47 44 45
49
28 37 38
30
Front of Microwave
Trial 2
Back of Microwave
36 35 37
34
35 51
38 48
48 46 47
45
29 36 36
30
Front of Microwave
As you can see, the first trial and the second trial were very similar, both showing the center of the microwave to be the hottest. The lower temperatures were found around the outside edges of the microwave, with significantly lower temperatures in the front corners. They were probably much lower because they were on the outside edge and were also closest to the opening of the door, which may leak hot air. Although these trials show that it is generally hottest in the center of a microwave, they do not help me to detect a 3D pattern. To try to do this I used a small plastic cup (2 inches tall) and repeated the procedure I described above except with the beaker on top of the cup for each trial.
Elevated Trial 1
Back of Microwave
38 32 35
33
36 43 34
49
46 43 39
50
25 32 37
29
Front of Microwave
Elevated Trial 2
Back of Microwave
37 35 34
33
38 42 39
47
40 43 39
48
27 33 35
26
Front of Microwave
Data File (Text)
Surprisingly, the elevated trial results were very similar to the non-elevated results. Of course there were a few exceptions, but human error in taking the temperature may have played a part in those. These results imply that there isn't a definite 3D pattern of heat waves in a microwave. However, many assumptions were made in conducting this experiment, the largest perhaps being that my home microwave is an accurate representative of all microwaves. I'm also assuming that I created my procedure in such a way that I would be able to detect a 3D pattern if it existed. There could have also been measurement errors or problems with the temperature of the microwave or the water (i.e. the microwave could have been hotter on one trial then it was on another, or the water may have cooler for one trial than it was on another, despite the fact that I made sure it read 20 degrees Celsius before each trial). Nonetheless, my hypothesis that hottest spot would be near the center of the microwave was correct.
Discussion Up
The data I collected generally supported my hypothesis, which was that the hottest spot, would be concentrated in the center of the microwave. However, I did not predict the two center squares on the far right and left to be close the center temperature. I also didn't predict the front corners to be way cooler than all of the other spots. Both of these findings make sense, though. Upon thinking it through, the front corners would be cooler because they are close to the door, and the center squares on the far right and left would be a couple degrees below the center temperature but higher than all the other ones because they aren't corners and they are close the center. I wasn't sure if I would find a 3D pattern in the beginning, but my results indicate that there is no specific one. An explanation of this may be that a 3D pattern cannot be detected by simply heating water; perhaps it requires more complex processes. In addition, through background research I found that opinions are different on whether the waves are moving or standing. Using common sense, it seems like if the waves were moving a turntable wouldn't be necessary because the heat would already be distributed evenly. Thus, this experiment and reason seem to indicate that the waves are standing; uneven distribution must occur when they collide. To further this research I could do more trials with different elevations, ranging, perhaps, from zero inches to five inches. That change has the potential to significantly alter my results. I could also try using a different amount of water, leaving it in for a different amount of time, using different size squares, or even trying multiple microwaves. I'm inclined to think that those things wouldn't alter the results much, but they are worth looking into.
Bibliography/Related Sites Up
1. Invention of the Microwave Oven. http://www.ideafinder.com/history/inventions/story068.htm
This site was useful in gathering
background information about the microwave.
2. Gallawa, Carlton J. Microwave Oven FAQ. http://www.gallawa.com/microtech/mwfaq.html
The frequently asked questions about
microwaves on this site were very helpful in understanding the technology behind
it.
3. Fun Things to Do with Microwave Ovens. http://www.everist.org/special/mw_oven/
This site included experiments that,
although interesting, I wouldn't recommend performing with your own microwave
oven.
4. Beaty, Bill. Unwise Microwave Oven Experiments. http://www.amasci.com/weird/microexp.html
This is a good reference for
those wondering, "What if I did (insert crazy scheme here) with a
microwave?"
5. Giancolli, Douglas C. Physics: Principles with Applications. New Jersey: Prentice Hall, 1998.
Our class physics book...a fairly useful
resource for those wishing to get a good grade.
6. Microwaves. http://imagers.gsfc.nasa.gov/ems/micro.html
This site was helpful in understanding how
actual micro-waves are used and depicted areas in our daily life where they are
depended upon.