[Back to research page]
Forces on a Boat
By Ryan Carpenter
Table of Contents
Background
Neglecting air resistance, there are two main directional forces acting upon a human powered boat. The first of these forces is the propulsion provided by the propeller which pushes the craft forward. This force is the result of a circular force provided by the unfortunate test subject. The circular force is attached to a large sprocket and travels by chain to a smaller sprocket underneath the hull. The small sprocket is directly attached to a smaller sprocket which transfers its power to a worm drive connected to the main shaft. The circular force of the main shaft spins the propeller and creates a net forward force to propel the boat. The many gear reductions helps maximize the forward force of the boat by creating many propeller revolutions per large sprocket revolution. Impeding force acting against the direction of the propeller is due to water resistance as the boat pushes the water out of its way. TOP
Statement of the Problem
How much net forward force per revolution does the propeller on my boat provide? TOP
Review of literature
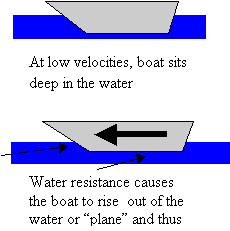
According
to about.com, my craft has a simple semi-planing hull which means that at slow
speeds, it will sit in the water and not generate enough lift to allow it to
rise above the water. Boat Safe Kids
adds that when the speed is great enough, the craft will be able to generate
enough lift to plane the water as its name suggests. If I am able to plane the water, the amount of resisting factors
will be reduced and a closer view about the amount of force the propeller
outputs can be attained. John Deere
adds that the maximum speed before the boat will plane (in knots) is equal to
1-1.5 times the square root of the length of the vessel. Whether planing or not, Mark’s Handbook
suggests that a significant clearance between boat and propeller assembly is
needed, but regardless, the propeller should never draw air. Mark's Handbook also says that the more
blades the propeller has, the less vibration the craft and shaft will
undergo. So in my case with a low rpm,
it would be best to use a propeller with many blades to ensure even propulsion.
To calculate the energy and power generated by the craft, IB includes the
formulas E = mgh and p = W/T on page 5 of their data packet. With this information, I will be able to
calculate the horsepower generated per unit of propulsion for the watercraft. TOP
Hypothesis
In this
experiment, the independent variable will be the amount of mass in the counter
balance while the dependent variable will be the resulting power required to
raise the mass. I hypothesize that the
lower the mass, the less power will be needed to hoist it up. I hypothesize this because with a smaller
mass, the operator should be able to attain a higher velocity and allow the
boat to rise in the water and plane.
When the boat planes, it is higher out of 
 the
water and thus faces a lower fluid fricative force. This relationship continues in a spiral until the boat reaches
its terminal velocity ( I don’t think I will be able to go that fast in the
experiment). For higher masses, I
hypothesize more power will be needed to hoist them. This should work in the opposite way as the lighter weights. The heavier mass will cause the boat to move
at a slower velocity then the lighter weights, impeding any planning action and
resulting in more fluid friction ending which will further slow the vessel
down. TOP
the
water and thus faces a lower fluid fricative force. This relationship continues in a spiral until the boat reaches
its terminal velocity ( I don’t think I will be able to go that fast in the
experiment). For higher masses, I
hypothesize more power will be needed to hoist them. This should work in the opposite way as the lighter weights. The heavier mass will cause the boat to move
at a slower velocity then the lighter weights, impeding any planning action and
resulting in more fluid friction ending which will further slow the vessel
down. TOP
Procedures
materials
1 boat
1 human power unit
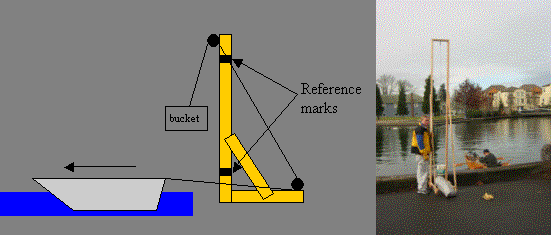
1 pulley equipped hoist
1 bucket
2 bricks of known mass
1 stopwatch
1. attach boat to pulley hoist mechanism
2. mark and record a distance of about 2 meters on the mechanism with the lower mark starting just above the rim of the bucket (the longer the better, doesn't have to be exact)
3. empty the bucket
4. tell subject to start peddling
5. start watch when the bucket passes the lower mark
6. count the number of individual strokes the subject takes
7. stop the watch when the bucket reaches the upper mark and record time and number of strokes
8. allow boat to return to the starting position and allow the subject to rest
9. repeat steps 4-8 four more times
10. repeat steps 4-9 adding one brick before step four
11. repeat steps 4-9 adding an additional brick (two total) before step four
-revision
Due to a sheering of the intended flex-drive drive shafts, a kayak paddle will be used instead of using the power from the propeller. TOP
Data
|
bucket displacement |
|
mass |
|
|
Energy |
|
|
|
|
2.6162 |
|
bucket 0 |
0.56 |
|
0 bricks |
14.35771 |
|
|
|
|
bucket 1 |
1.7847 |
|
1 bricks |
45.75749 |
|
|
|
|
bucket 2 |
3.0094 |
|
2 bricks |
77.15728 |
Raw Data
|
|
|
0 |
|
1 |
|
2 |
|
|
strokes |
time |
strokes |
time |
strokes |
time |
|
|
8 |
5.24 |
10 |
7.38 |
15 |
10.41 |
|
|
8 |
4.53 |
9 |
6.23 |
16 |
9.79 |
|
|
8 |
5.44 |
10 |
6.61 |
18 |
12.56 |
|
|
7 |
5.97 |
9 |
5.97 |
18 |
11 |
|
|
7 |
4.36 |
11 |
5.87 |
20 |
12.24 |
|
average |
7.6 |
5.108 |
9.8 |
6.412 |
17.4 |
11.2 |
|
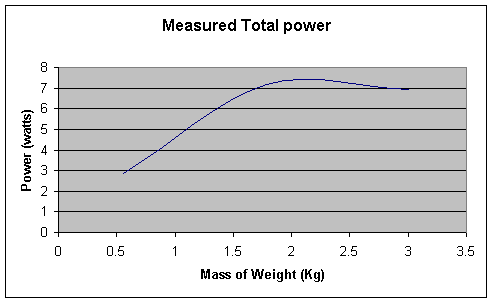
power (watts) |
|
|
|
|
|
|
|
|
|
0 |
|
1 |
|
2 |
|
|
|
power |
|
power |
|
power |
|
|
|
2.74002 |
|
6.200203 |
|
7.411843 |
|
|
|
3.169471 |
|
7.344702 |
|
7.881234 |
|
|
|
2.639284 |
|
6.922465 |
|
6.143096 |
|
|
|
2.404976 |
|
7.664572 |
|
7.014299 |
|
|
|
3.293052 |
|
7.795144 |
|
6.3037 |
|
average |
|
2.849361 |
|
7.185417 |
|
6.950834 |
|
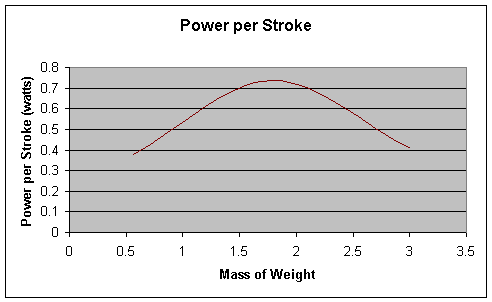
Power (watts)/stroke |
|
|
|
|
|
|
|
|
|
0 |
|
1 |
|
2 |
|
|
power per stroke |
power per stroke |
power per stroke |
|||
|
|
|
0.342503 |
|
0.62002 |
|
0.494123 |
|
|
|
0.396184 |
|
0.816078 |
|
0.492577 |
|
|
|
0.329911 |
|
0.692247 |
|
0.341283 |
|
|
|
0.343568 |
|
0.851619 |
|
0.389683 |
|
|
|
0.470436 |
|
0.708649 |
|
0.315185 |
|
average |
|
0.37652 |
|
0.737723 |
|
0.40657 |
|
|
|
|
|
|
|
|
Text version
Data
Analysis
From this graph, it is visible that there is a very low power requirement to lift the low mass, then the amount of power needed begins to greatly increase forming what appears to be a square root function, but with a slight downturn at the end which could signal a terminal friction being reached or more likely just human error. According to this data, the low power required to lift the lighter masses shows that there was at least a slight amount of planning occurring that reduced the water friction and allowed the vessel to attain a high speed and use a minimal amount of power. The data also proved my hypothesis for the heavier masses, at such a slow velocity, the boat experienced a great deal of friction and was not able to plane and thus required more power to pull up the bucketTOP
.
This power per stroke graph is a little beyond my hypothesis, but the way it increases then decreases might lend to a theory of a terminal friction threshold for this boat in which like static friction, once the threshold is passed, power is greatly decreased.
Even though my data made many correlations with my hypothesis, the experiment I completed had a great deal of uncertainty in it. To start out, I was not using calibrated masses in the experiment, nor a great amount of increments. To correct this uncertainty, I could include at least three more intermediate masses and use things more accurate then bricks. Another cause for uncertainty was the friction and elasticity of the rope. The nylon rope encountered a great deal of friction on the pulleys and was fairly elastic. This could easily contribute to skewed and inconsistent data. To fix this problem, I could use steel wire and greased pulleys that would nearly eliminate any uncertainty associated with the rope. There was also a great deal of uncertainty associated with the kayak paddles. The uneven motion of paddling diverted from a strait line in some cases and caused a “zigzag” pattern. This could be fixed through the repair of the propeller shaft which would significantly reduce jarring. Uncertainty can also be accredited to the two Styrofoam pontoons attached to the boat along with non-streamlined, non-smooth parts of the boat. These problems could be fixed by better calculating displacement, creating a more efficient hull design, and reducing drag on rough surfaces and propeller.
To further explore the forces on a boat, I could find the curve of friction coefficients compared to speed of the boat and even test out different hull designs and their comparative forces. TOP
Bibliography TOP
Mark’s Standard
Handbook for Mechanical Engineers.
Multiple Authors. Copyright 1978 McGraw Hall. New York. – way too much information about everything
International Baccalaureate Organization. “Physics Data Booklet.” Geneve, Switzerland. 2002 – handy dandy formulas
http://powerboat.about.com/library/weekly/aa012403a.htm - info on hull designs
http://www.deere.com/en_US/rg/marketapplications/marine/hull_types/ - nothing swims like a Deere.
http://www.boatsafe.com/kids/022298hulls.htm - teach your kids to be safe and the benefits and drawbacks of different hull designs