Kelsey Miglioretto's Research Page
Do Harmonics Determine Vowel Sounds?
Background|Setup|Method|Results|
Have you ever heard the sound of dogs barking, a door slam, or an
audience applauding? These, along with all other sounds, have one thing in common.
They have their own set of harmonics, also known as overtones, that
when heard at the same time create what we call that certain sound.
Now there are two parts to sound.
There is noise and there is music.
The sounds I gave for examples would be placed in the noise category
because the harmonics that make up that sound are so disorganized that no real
pitch can be heard. This is why
the noise sounds unorganized and sometimes unpleasant.
In music the harmonics are organized in such a way that a definite
pitch can be made out. Harmonics
play a part in what the pitch is and also how the pitch sounds to the human
ear. How it sounds is called the
tone color or timbre, and cannot be defined quantitatively only in qualitative
terms such as bright, warm, ringing, hollow, or brassy (Kerman 11). The differences in the relative amplitudes of the various
harmonics that make up the pitch cause the differences in musical instruments
(Giancoli 361). This is what
makes an oboe sound different than a clarinet or a piano different than an
organ (Lampton 36).
However, the most distinctive tone color of all is the human voice
(Kerman 11). The human voice is
fascinating. While all man made
instruments with the same name sound alike, no human voice sounds like
another. As with the differences
in instruments, this is caused by the differences in harmonics between each
person. Everyone creates their
own set of harmonics that is unique to them, just like fingerprints (Berger
24).
I have noticed, while observing Tualatin High School’s Treble Choir,
that when the choir is singing a unison pitch on the same vowel, a vowel is
defined as a sound that is the result of the acoustical properties of one’s
vocal tract that is also governed by the position of one’s lips, jaw,
tongue, and velum (Wall 3), and one person is singing a slightly different
vowel then that person sticks out even though they would normally be drowned
out. This leads me to my
question. Harmonics make a
difference in pitch and timbre. In
my research I will answer the question as to whether or not harmonic structure
makes a difference in vowel sounds as well.
I hypothesize that each vowel sound will have its own harmonic
structure.
Here
is a diagram of my setup-
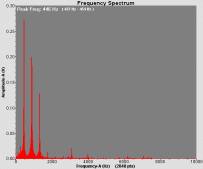
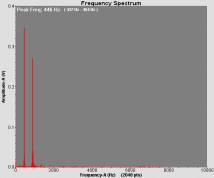
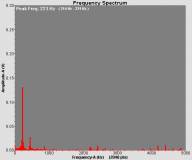
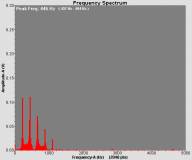
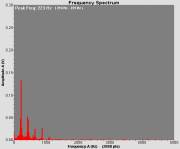
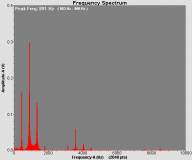
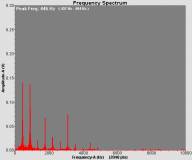
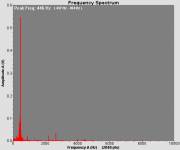
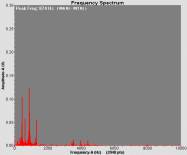
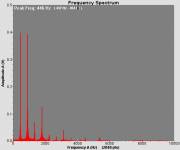
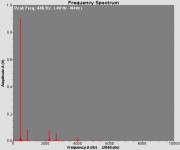
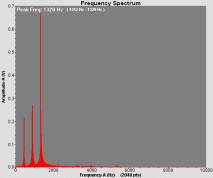
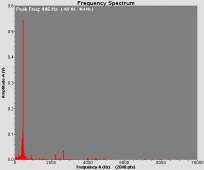
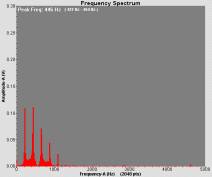
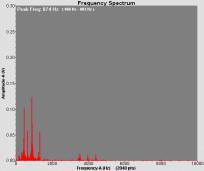
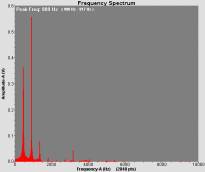
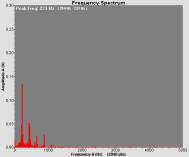
To
get the harmonic structure of each vowel I used FFT which analyzes the voice
and gives the amplitude of each overtone in volts. Each singer sang a given pitch, which was an A at 440 Hz for
the girls and at 220 Hz for the guys, for a sustained time.
The note was given from the same pitch pipe each time.
After I made sure they were singing the pitch correctly and steadily I
took the data. The program
records about one-tenth of a second of the person singing.
After I took all the data points I printed out the graphs and laid them
out side by side to see if I could see any similarities or differences.
Because of the nature of the data the analysis is mostly qualitative.
Graphs organized by participant
Participant 1 | Participant 2 | Participant 3 | Participant 4
It might take a couple seconds for the graphs to load.
Ah Eh
Oo
Participant #2
Ah Eh
Ee Oh
Oo
Participant #3
Raw Data
Ah Eh
Ee Oh

Participant #4
Ah Eh

Ee Oh
Oo

Ah Vowel|Eh Vowel|Ee Vowel|Oh Vowel|Oo Vowel
It might take a couple seconds for the graphs to load.
Ah Vowel
Raw Data
Participant #1 Participant #2

Participant #3 Participant #4
Participant #1 Participant #2


Participant #1 Participant #2

Participant #3 Participant #4

Participant #1 Participant #2

Participant #3 Participant #4
Participant #1 Participant #2

Participant #3 Participant #4
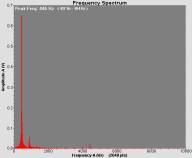
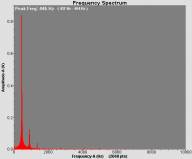
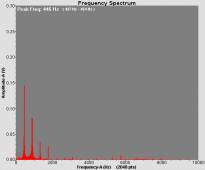
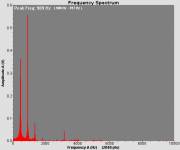
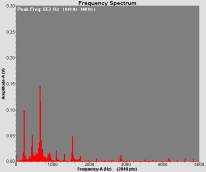
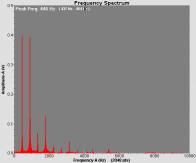
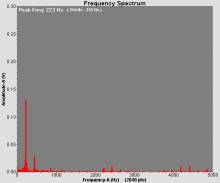
My data supported my thesis that each vowel has its own harmonic
structure. The ah vowel was
typically dominated by the fundamental and first two harmonics.
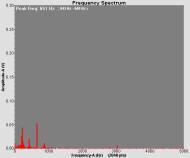
The eh vowel had many of the harmonics mixed together.
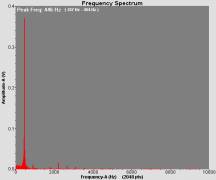
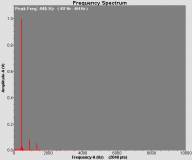
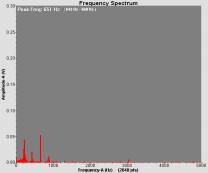
The ee vowel was dominated by the fundamental with little from any of
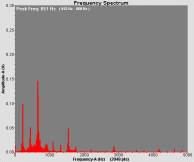
the other overtones. The oh vowel
had many of the overtones but the fundamental, first and second harmonics were
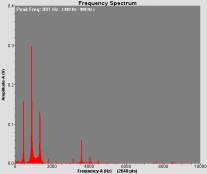
the most prominent. Finally, the
oo vowel, like the ee vowel, was dominated by the fundamental but had more
assistance from other harmonics.
With these comparisons made I can see now why each vowel sounds as it
does. The ee and oo vowels have a
somewhat hollow sound at times which can be attributed to the fact that the
majority of their harmonic structure is made up of the fundamental.
Also the rest of the vowels tend to sound fuller and their structures
are more split equally among the other overtones, how they are split depends
on the singer.
My actual lab did not have many difficulties I had to face in making
sure it worked right or finding hidden variables I might not have overlooked.
There were a few problems I ran into which caused me to discard some
data. One set was incomplete and
some parts were mislabeled, so I could not properly analyze all the vowels
because I was not sure which were which.
The other had sung to low, for the graphs to make out any clear
harmonic structure. Overall they
all sung on pitch, which should be expected seeing that all of the
participants are in this school’s chamber group, and at the relatively same
volume.
While analyzing the data I noticed that I could not successfully
analyze the graphs quantitatively. Each
person has their own harmonic structure that is unique to them.
This was already known from the background research.
I tried to use the actual values for each of the overtones to find
things like the percentage of the structure each harmonic took up.
In the end I found this step to be quite redundant.
Firstly, the numbers did not match up closely because of the different
structures. Also, it came up with the same qualitative results that I
could get from the original graphs from the fft.
It would be interesting to go further on the analyzing of these graphs
to see if we could quantitatively map a persons harmonic structure.
What would have to be done is when the data is taken a person educated
on the subject of voice quality would write down what they hear on each vowel.
For example, they would see if a person was singing loud or soft and
what the timbre sounded like. These
qualitative descriptions of the voice itself would then be compared to the
graphs of the singer’s voice to see if any patterns could be made.
It would also be nice to do this experiment on more people to see if
the pattern continues.
Berger,
Milton. The Science of Music. New York: Harper Collins, 1989.
Giancoli, Douglas C. Physics:
principles with applications. Fifth Edition. New Jersey: Prentice-Hall,
1998.
Kerman, Joseph. Listen.
Third Brief Edition. New York: Worth, 1996.
Lampton, Christopher F. Sound:
more than what you hear. New Jersey: Enslow, 1992.
Wall, Joan, Robert Caldwell, Tracy Gavilanes, and Sheila Allen. Diction for Singers. Dallas: Pst...Inc.,1990.
"Fundamental Frequency and Harmonics"- From "The Physics Classroom." A good introduction to harmonics and frequency. Explains nodes and anti-nodes. Also has information on wavespeed in relation to wavelength and frequency.
"Natural Frequency"- Also from "The Physics Classroom." Begins to connect harmonics in musical terms. Defines timbre and how harmonics cause the timbre that is heard.
"Understanding Harmonics"- Starts from the beginning. Defines pitch and the wave thoery. Also explains how to play harmonics and how to calculate them.
"Vocal Tract Resonance"- Illustrates the human vocal chords and how sound is resonated in the human body.
"Vowel Sounds"- Explains how vowel sounds are formed by humans.
![]() Thank you Webground for the awesome background
Thank you Webground for the awesome background ![]()