By Patrick Morrow and Mari Kam
Introduction|Method|Results|Uncertainties|Discussion|Works Cited|Links|Return to Research Page
You would not think that the rubber band planes that kids play with as toys today had any relevance in our history. But, in fact, the commercial airplanes that you ride on every day originated from the simple idea of the rubber band airplane. Many scientists’ ideas on aerodynamics started with a plane as simple as one powered by a rubber band. Alcorn studies the best model of a paper airplane by manipulating the wingspan area, the folded shape of the wing, the nose shape, and the angle of the launch, similarly, we hope to identify the best model of a rubber airplane by manipulating its weight and propeller speed.
"First to Fly" notes that the rubber band powered airplane is one of the most important inventions leading up to the invention of the airplane. It has allowed researchers to test configurations of the various parts of the airplane in order to build full size flyable airplanes. The rubber band is an "extremely capable engine for an aircraft" which has progressed over the years. Rubber band airplanes are capable of flying amazing distances. In 1909 Wilbur and Orville Wright flew a rubber band plane just over 200 feet. And, by 1924, Thomas Hail was able to fly his model over 7920 feet in ten minutes and fourteen seconds. Moreover, the Wright brothers, as you may know, contributed greatly to the invention of the airplane. These two high school dropouts’ imaginations, which were sparked by a rubber band powered toy, are what started them in their dream of creating a manned airplane. It took them two years of experimenting and manipulating their designs in order to make their dream a reality.
In great detail, David Anderson attempts to understand and define the physical description of flight. Anderson argues that lift is easier to understand if we understand Newton’s Laws. Using Newton’s third law, which states that a body at rest will remain at rest or that a body in motion will continue in a straight line in motion unless subjected to an external applied force, he attempts to explain lift. "What the wing does to the air is the action while life is the reaction" (Anderson 2001). Thus, to generate lift the wings of a plane must divert lots of air down. Anderson also goes further to explain the Coanda effect and the fact that the resistance to flow gives the air a "kind of stickiness." In understanding Newton’s laws Anderson makes several conclusions about flight: the amount of air that is diverted by the wings are proportional to the speed and air density, " the vertical velocity of the diverted air is proportional to the speed of the wing and the angle of the attack." Furthermore the power needed for lift is also proportional to the lift times the vertical velocity of the air. From what Anderson argues we can easily understand lift and use it to discover many more powerful aspects of flight.
Williams has studied the consistency of a rubber band airplane to fly the same way repeatedly and dependably. There are many factors that come into play when studying the consistency of a rubber band airplane. First of which is having a stable airframe. There is a dynamic balance that affects the stability of the plane; gravity and the air pressure that the plane flies in. Williams emphasizes the importance in experimenting to take all factors into consideration in order to make a more perfect experiment on rubber band airplanes. Williams goes on to take into consideration the force of torque. The torque will make a plane in flight tend to turn in the directions opposite to the direction in which its propeller is spinning. In William’s experiment he attempts to make his plane fly in a circle. But in our experiment we will be connecting the plane to a string, forcing it to follow the path of a straight line and giving it a given distance. Moreover, Williams also takes into consideration the type of rubber band that he is using and the material that the planes are made out of. "Rubber motors are sized to wind at an optimum rate for the plane and its propeller." Thus, Williams argues that the thinner the rubber band is the better it is to power rubber band plane models.
This study is to determine how the mass of the rubber band airplane and the amount of windings of the rubber band affect the velocity of the rubber band airplane. We hypothesize that after manipulating the mass and the amount that we wind the rubber band the plane will go the farthest when its mass is least and its power, by the rubber band, is the highest.
Using these items we created a path on which our airplane would fly on and used the stopwatch to time the amount of time it took for the plane to get from one chair to the other. In order to manipulate the experiment we changed the amount of times the rubber band was wound and added mass by adding Pearler Beads to the plane.
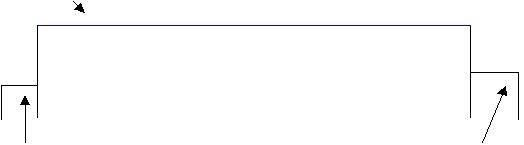
1. In order to conduct this experiment we found it most affective to use a piece of fishing line that was tied to the ends of two chairs. We put weight on both of the chairs in order to ensure that the fishing line was taut.
Fishing Line
Chair Chair
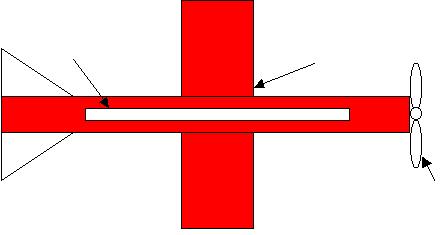
2. Then, using masking tape, we connected a drinking straw to the top of the rubber band airplane.
Straw Airplane
Propeller
3. By placing the fishing wire through the straw we created a path on which the plane could fly a set amount of distance.
Fishing Wire Straw
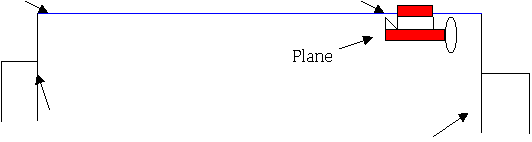
Chair Chair
4. In order to record the amount of windings the rubber band took, we used a rubber band counter, which winds the rubber band and counts the amount of times the rubber band is wound.
5. We clocked the time it took for the plane to fly across the fishing wire with a set amount of added weight. Then we continually added more Pearler Beads to the bottom of the plane to alter the weight and to see how it affected the time.
Overall our method was to wind the propeller, in increments of five, starting at 85 and ending at 105. We made sure that each time the plane would reach the end of the wire, so that the distance of the plane would stay constant.
Velocity vs. Windings Graphs:
In order to evaluate the relationship between the amount the rubber band was wound and the velocity that the plane flew at, we created graphs of Velocity vs. Windings for each mass.
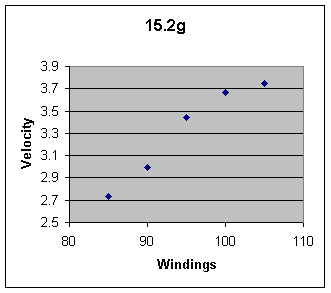
In this graph it is apparent that when the mass was the least, 15.2 grams, the more windings the rubber band had the faster the velocity was. It seems as though as the windings increase the friction increases, therefore decreasing the increment of velocity that each winding gave.
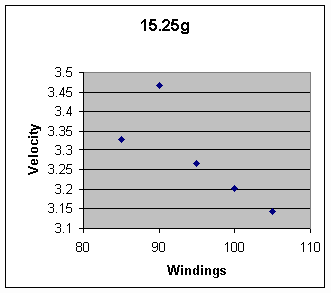
In this graph, the mass is at 15.25 grams and it would seem as if as the winding increases the velocity decreases. With an increase in windings there is an increase of friction created thus decreasing the velocity.
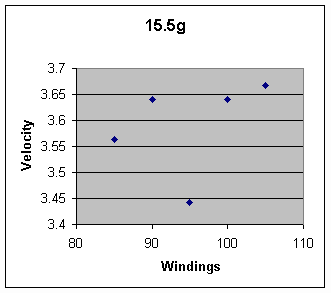
It would be expected that if the amount of windings were to increase, the velocity would rise steadily because the mass is decreasing the friction due to the access of movement with increased windings.
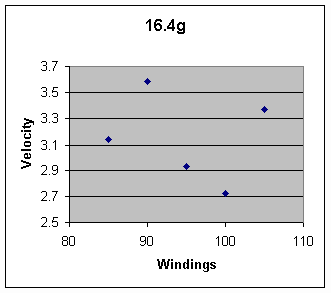
In this graph, if we disregard the velocities at 95 and 100 windings the velocity seems to increase until the winding friction begins to decrease the velocity.
In examining these four graphs there are many errors that can contribute to our calculations. We used several different rubber bands in collecting data for this experiment. Once we found a rubber band that did not wear out during our experimentation it seemed too powerful for the string that the plane was connected to. Thus the plane tended to sway back and forth on the string as it flew, creating a varying amount of friction. So, when we examine our data on the graphs it is difficult to determine the relationships between windings and velocity. It is also important to take into consideration that because of the rubber band’s inconsistency we were incapable of collecting enough data to represent the relationship accurately. But from the data we collected it seems that we are unable to determine the relationship solely by the increase in mass. Thus, we further examined the relationships by creating graphs that compare the relationship between velocity and mass for each winding group.
Velocity vs. Mass Graphs:
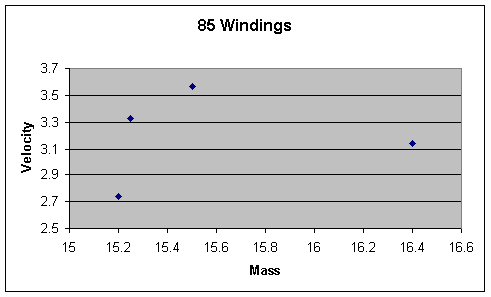
In examining this graph we can see that as the increase in mass stabilized the planes flight thus increasing the velocity until the mass stopped stabilizing the velocity and began contributing solely to the friction.
. 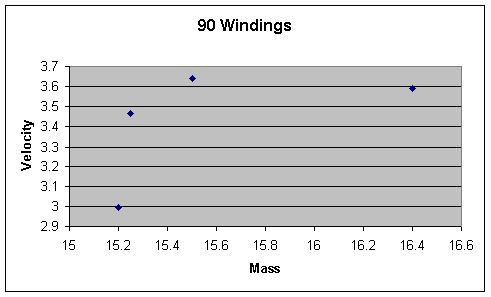
Then, as the windings increased to 90, we can see that the relationship stayed constant.
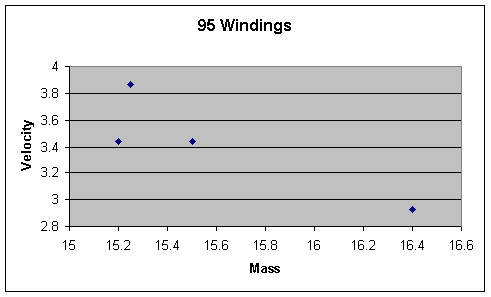
In this graph the relationship stayed constant, except as the mass increased the amount of friction that the mass contributes to was created at a faster rate than it was with lower amounts of windings.
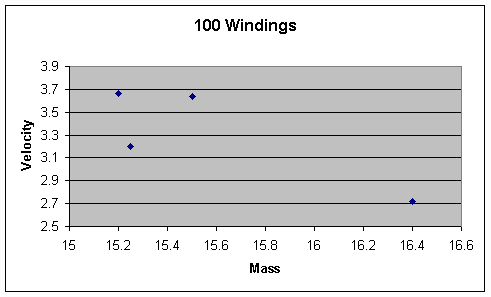
In disregard to the velocity when the mass is 15.2 grams the graph follows the same trend in which it has followed before. We disregard the velocity at 15.2 grams assuming that at this point there was a significant amount of error that contributed to its location.
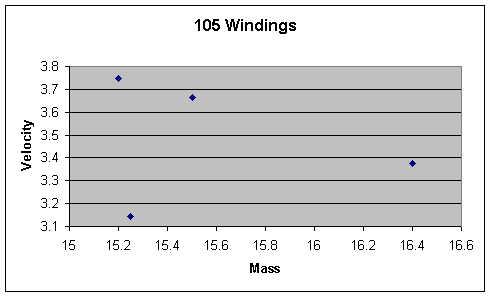
Once again, the graph when the windings are at 105 seems to increase and then immediately decrease as the mass begins to get bigger and affect the friction.
In analyzing these graphs we found that on average, as the mass increased the velocity increased to a certain point, then as the mass stopped stabilizing the flight the velocity began to decrease.
From the two different types of graphs that we created we are able to conclude that the velocity only increases until the mass and the amount of windings create enough friction to hinder the velocity of the plane.
Rubber Band
In the course of our experiment we found that it was difficult to find a rubber band that was able to work for the full amount of time we were experimenting. Many of the rubber bands seemed to ware out the more times we wound them ultimately affecting the amount of data that we were able to collect. This hinders our ability to discover the relationship between mass, velocity, and windings In order to keep the distance of the plane constant we needed to ensure that the rubber band would be able to continually get the plane all the way across the fishing line. But, as we experimented we found that after a certain amount of trials the plane was unable to travel to the end of the fishing line. The rubber band that we eventually decided to use was not a rubber band that was made for rubber band airplanes. It ended up being more powerful than the regular rubber bands that we had been using. Therefore, causing a greater amount of friction with the fishing line.
Fishing Line
We also considered the amount of heat that was created between the straw and the fishing line due to repeated trials. At one point we attempted to cool the wire by rubbing ice on it to see if it would help the plane to get across the given distance.
Windings
With the rubber band that we used we needed to find the appropriate amount of windings in order to ensure that the plane could get across the fishing wire. This was difficult because if we wound the rubber band too much, the plane would sway back and forth on the string because of the torque of the propeller.
Mass
Another interesting factor that we had to experiment with was the amount of mass to add to the plane. The plane itself needs to be relatively light in order for the rubber band to successfully power it. At first we attempted to use pennies and dimes to increase the weight of the plane. But we found that by using just two pennies, this amount of weight was too much for the plane to move. We found that we needed something that was light enough that the plane could still get all the way across the fishing line yet heavy enough to alter the mass of the plane.
It was found that our original hypothesis, that the plane will go fastest when the mass is least and its power is highest was not true to a certain point. When we examined our raw data we found that when the mass was lowest and the amount of windings was highest the velocity was the greatest. But, when the velocity should have been the least, when the mass was highest and windings were lowest, it was not. We only had enough data to identify that our hypothesis was partially correct. The rest of the data, as a whole, seems not to follow any particular trend. But, when examined separately, by winding groups and mass, there are separate trends that the data follows. We were able to conclude from this data only that as the mass and the amount of windings increases the velocity tended to decrease.
What we would expect to happen is that as the windings increased the mass would more so help to increase the velocity due to the mass contributing to stabilize the flight. However, it seems as though as the windings increase the mass tends to decrease the velocity, when the mass increases. This could be due to the position of the extra mass added to the plane. We placed the beads on the bottom of the plane, which could contribute to the amount of friction due to its sway. It would contribute to the friction because in order to give a good time to our experiment the plane needs to fly across the string as straight as possible. But, because we put the mass on the bottom of the plane it contributed to the swaying, caused by the rubber band, and slowed the flight of the plane. This movement was increased because by being on the bottom of the plane it gives the plane a lower center of gravity. If we had placed the extra mass on the top of the plane it possibly could have helped to decrease the movement of the plane.
Another possibility to why as the windings increased the mass decreased the velocity could be because of the path of the plane. Usually, the rubber band airplane is able to fly long distances with fewer amounts of windings. This is because of its ability to turn and go on its own course. But for this experiment we needed the plane to go straight within a set amount of distance. If the plane had not been set on a string the added mass would hinder the planes ability to fly as far as it could. But because the plane is on a string and there is friction involved our graphs illustrate how the mass helps to control the plane at first, but as the windings become greater just adds to the friction of the plane. The fact that the plane was unable to fly the path that it wanted to go could contribute to why as the mass increased it increased the friction making it more difficult for the plane to accelerate.
Because of the way that the experiment was set up it hindered our ability to see the full potential of the plane. We were not able to get the full range of what the graph could look like because the plane was set up to fly a set distance on the string. But, if we had conducted this experiment by starting the plane off on the ground it would have been able to use its wheels to push off of the ground and probably would have been able to go farther at a faster velocity. The way that our experiment was set up made it so that the plane did not push off of anything, rather it needed to get enough power to start in the air. Furthermore, because we stopped the plane in the middle of the flight to keep the distance constant it made it difficult for us to see the full potential of the plane. If we were to compare our set up to one in which the plane takes of the ground we would find that there would be more accurate results. If the plane had taken off of the ground there would be less friction, because of the fact that the whole weight of the plane rests on the wheels instead of the string. This is important because this friction would contribute to a distortion in our graph. If the plane could fly straight freely we could measure the distance that it goes at a greater variety of windings. Also, if the plane was on the ground, the added mass could only contribute to slow the flight of the plane rather than stabilize its flight. Therefore our graphs are limited to only a section of what the graph would look like in a perfect flight situation. It is likely that the section of the graph that we have found is distorted from the amount of friction and other contributing factors of our errors.
If someone were to further this experiment there would be a couple of different factors that they would have to take into consideration. They would need to discover a way to be able to get more data points. In order to do this they would have to do something along the lines of finding consistent rubber bands that you would be able to test the elasticity of and switch them before they wore out enough to alter the data.
"Aerodynamics and Parameters" 2001
http://206.19.56/WilliamsChapter1.htm
Anderson, David and Eberhardt, Scott. "Physical description of Flight" 2001
http://www.aa.washington.edu/faculty/eberhardt/lift.htm
"First to Fly." Homepage. "Wright Brothers Aeroplane Company and Museum of Pioneer Aviation" 2002
http://www.first-to-fly.com/History/Wright%20Story/wright%20story.htm
National Student Research Center, The. "E-Journal of Student Research: Science." Vol. 3, Number 9. Jul. 1995
http://www.youth.net/nsrc/sci/sci.017.html
"The Wright Way to Fly" 2001
Source unable to Read
http://www.aa.washington.edu/faculty/eberhardt/lift.htm
This site was good to understand all the elements of flight and how they related to our experiment.
http://www.geocities.com/sciolyevms/events/wrightstuff/
This site shows how to build a event quality balsawood airplane.
http://www.youth.net/nsrc/sci/sci.017.html
One of the experiments on this site test the distance of flight for the surface area, shape of nose and the shape of the wing for testable airplanes.
http://www.grc.nasa.gov/WWW/K-12/airplane/bga.html
This site discusses basic ideas of aerodynamics including various equations that were useful in our project.