IB Physics
Research Project
A Study on the Orbital
Velocities of a Binary Star System
Orbited by a Single Star
By Jody Forness
IB Physics II
January 13, 2003
Those who say that money is
what makes the world go ‘round are wrong. It’s gravity! Gravitation is defined as the force of
mutual attraction between
all bodies. Gravity governs the orbits
of planets, stars, and their orbits with each other.
Did you know that “half of all stars in the sky are
members of binary systems” (Astronomy…)!
Whether these systems are light years apart or are very close, they are
everywhere and controlled by the same force--gravity. This puts the universe into a new and more connected
perspective. It also makes the
importance of binary star systems more apparent, because the only way we can
measure the mass of a star is to study its orbit. That is one way the system is helpful and why astronomers and
physicists today find binary systems so fascinating!
A binary star system consists of two stars orbiting around the same point called the center of mass. These systems are formed, as one hypothesis suggests, from collapsing gaseous materials that form multiple stars (two, in this case) that are close together.
These
two stars create an orbit around each other, and Isaac Newton’s law of
universal gravitation becomes applicable.
Every particle in the universe
attracts every other particle with a force that is proportional to
the product of their masses and inversely
proportional to the square of the distance between
them. This
force acts along the line joining the two particles (Giancoli).
(This
law is broken down into a formula that I use to calculate velocity later in the
experiment.)
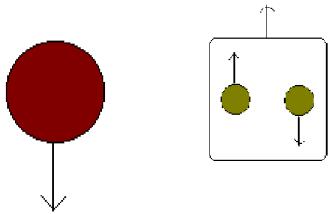
Here is a diagram of a binary star system in two opposite phases of its rotation:
+ = center of mass

As one man would say, they are “stars whose fates are permanently linked by gravity” (Physics…).
The apastron (not that we care about the name) is
the point where the two stars are furthest apart and their orbits are
slowest. The periastron (not that we
care about this name either) is the point where they are closest together and
have the fastest orbits. Also worth
noting, the star with the most mass has the smallest orbit (which just means
that my dependent variable should be the star with the less mass because its
orbit will contain the most variance).
Multiple star systems, which are
exactly like binary star systems just with more stars, also exist, but many
times, it is difficult to tell. For
example, one binary system may have a third star orbiting far away. There is no sure way to know because the
third star may only pass through our scope of vision every 5000 years. Another example of the unknown that we
operate under is our own Sun. Some
astronomers have hypothesized that our Sun may have a “stellar companion” of
low mass beyond Pluto (Physics…). The
point is, while we claim to know all of the above information, there is still
much that is undiscovered. One such
idea is the possibility of having two binary systems orbiting each other. It seems plausible that if most of the stars
out there have “companions” and that multiple star systems exist, that a system
of two binary systems exists. That is
what I initially wanted to test; however, the computer simulation I used to
test my hypothesis works better if there is only one binary system.
In my experiment, I want to learn whether the
stability (measured by variance in velocity) of a binary star system that is
being orbited by a larger star is dependent on the distance from the single
star to the double star system. My
hypothesis is that as the distance increases the variation in velocity decreases,
creating a stable orbit. The distance
allows the periastron to occur far enough away so as not to send the stars
crashing into each other. Also, the
further distance is consistent with what one might hypothesize about the real
world (Obviously, we don’t see stars crashing into each other. So, there must be some relation to
distance).
A B C
Method
It is readily apparent why I can not explore this phenomenon in the real world. So, I used the Interactive Physics Program that creates any world I want for the experiment. I began by drawing three stars and setting the mass of Star A to 6*10^24 kg (6e24) and the mass of Stars B and C to 3e24kg. Then I used a few formulas to calculate the velocities. This is the tricky part because not only do I want to send the two smaller stars into an orbit, but also I need to send the whole binary system in an orbit around the bigger star. Here’s a picture of the working setup:
My parameters had planetary gravity accurate to 2500.000 seconds.
I used the following formulas to calculate the velocity:
F=Gm1m2/r²
![]()
![]() F=ma + a=v²/r F=mv²/r
F=ma + a=v²/r F=mv²/r
![]() mv²/r=Gm1m2/r²
v=½(Gm/r)^½
mv²/r=Gm1m2/r²
v=½(Gm/r)^½
I can check this answer using dimensional analysis:
Gm/r
= (Nm²/kg² * kg)/m = (kgm/s² *m² *kg/kg²)/m = m²/s²
v =
(m²/s²)^½ = m/s
The
equation is correct, and I am ready to begin the simulation as soon as I
calculate each star’s orbital velocity.
Star
A—
v = ½((6.672e-11*6e24)/1.5e8)^½ = 816.8231m/s
(I’ll make this negative.)
Star
B—
v =
½((6.672e-11*3e24)/1.5e8)^½ = 577.5812m/s (I’ll make this negative too.)
Star
C—
V =
½((6.672e-11*3e24)/0.5e8)^½ = 1000.39992 + vA = 1817.223m/s
In
order to set the two smaller stars in an orbit around themselves, I made the
distance between them constantly 1e8m which made the radius constantly
0.5e8m. Star C uses this radius while
Star B uses the radius between it and Star A.
Then, assigning Star A a negative velocity means that the total velocity
of the binary system should be equally positive. To do this, add the velocity of Star A to Star C (which will
always have an initial velocity of 1000.39992). Voila, there is the breakdown.
Since my hypothesis tests distances, I chose the distances 3e8-12e8m
using 1e8m intervals. There are ten
spans.
I wasn’t sure how I was going to
measure variance. A few ideas came to
mind, and so, I calculated the minimum, maximum, and average. I tried to use some sort of equation that would
capture the variation, but in the end, the trusty formula for standard deviation
worked well.
Raw Data
The collection of data is another
story. The best way is to have
Interactive Physics make a graph of the
velocities
as they are being recorded. From there,
you can take the raw data and use excel to sort and graph.
Here’s
an example of the raw data. The
collection is vast, so, I will not use all of it.
|
Time (seconds) |
Velocity (meters/second) |
|
0 |
367.636 |
|
2500 |
369.266 |
|
5000 |
374.111 |
|
7500 |
382.04 |
|
10000 |
392.854 |
|
1.25E+04 |
406.307 |
|
1.50E+04 |
422.123 |
|
1.75E+04 |
440.026 |
|
2.00E+04 |
459.742 |
|
2.25E+04 |
481.019 |
The
above graph is of the velocity of Star B over time. The distance used was 5e8m.
At this particular distance, the orbit cycles through quickly and begins
again. For the purpose of conformity, I
tried to cut off each trial after the first cycle. This graph represents an ideal situation; however, some went
completely of the chart.
This graph was done at a distance of 3e8 and it confirms my hypothesis that the closer the binary system gets to the giant star, the greater the variance. This setup eventually broke down.
Analysis
The minimums and maximums that I calculated do not
seem relevant. I switched to the
standard deviation and graphed it as a function of distance.
From the graph, it seems there are two data points skewing
the results.
The first and fourth points indicate places where my hypothesis would not hold
up. Data Point 1 was askew from the
beginning. As the orbit continued, it
broke down. Star B crashed into Star
A. I should throw it out. In addition, both Data Point 1and 4 may have
been thrown off when I did not let them run through a complete cycle. The one error to a computer program involves
a human.
Without those data points the
graph follows my hypothesis.
Conclusion
The data does not explicitly show that variance in velocity decreases with increased distance, but it does show a downward trend even with the expendable data points. This means that the general theory is correct in regards to this experiment and there is more chance for the inconsistent data to be related to human error. First, in the data I took, I was inconsistent. I looked for the full orbital cycle and many times, I did not get it. Realistically, I could not wait forever, and the computer would have run out of memory. I do not know how to account for that kind of human error. After all, any account would be theoretical because we do not know what would have happened if the simulation had played out. Second, although it is a computer simulation, it is still computing massive amounts of data, and during the second cycle, due to rounding or something like that, it does not match up with the results from the first cycle. So, even if I did continue with the simulation, the distinction between the first and second cycle would still create a problem of uncertainty. It may take a bigger, better computer to run through the simulation and mathematically find the repeating point. We don’t have a bigger computer. In the future, I would just try to gather as much data as possible. As for the limitations of the computer program, those are permanent. For a high school physics project, though, the equipment was adequate to get a glimpse at the answer to my question. When is a binary system stable orbiting a single star? It is most stable when it is furthest apart. Gravity has less pull which means less chance of sucking one of the stars into its gravitational field and BOOM!!!!

B A A B
the periastron
DAY A
My research proposal asks: How close can two binary star systems come before significantly affecting each other? Where are the stable differences? My independent variable will be the distance apart they are, and I will measure the velocity. I've decided to use the Interactive Physics Program to gather the data and then to use excel to calculate and graph.
Distance

A B C D
DAY B
I revised my proposal. Creating two binary systems would be difficult, so it will only be one. I have also considered the actual question and have decided it is too vague. To specify when the systems affect each other and where it is stable, I will find some kind of equation for the variation of velocity. That should tell me when the orbit is "stable." My research proposal is: To explain the velocities of one star within a binary system when it is placed at different lengths from the larger star.
DAY C
I am researching my background information. The internet is the most helpful. I keep coming back to one web site. The guy in charge is a professor of physics. Also, NASA has a question-answer page where one guy admits he doesn't know all of the answers to the questions asked. It makes me nervous that NASA doesn't know everything but random professors do. The textbook is not much help. I've found Kepler's Laws and will incorporate them though.
DAY D
I started on the computer today. With Murray's help, we set up the Interactive Physics program for outer space conditions, and then set up our world. The largest star, we will make roughly the size of the earth. It will rest at the origin (0,0). The binary stars we will make immediately to the right with half the mass of the first star. My setup now looks like this:

A Distance B C
I have found the equation to give me the velocities.
v = 1/2 (Gm/r)^1/2
G = 6.672E-11 Nm^2/kg^2
m = 6E24kg; 3E24kg
r = variable
My results are interesting. It seems the orbit has repeated itself. However, it is not exact because the graph becomes smaller and smaller as the cycle continues. I wonder what would happen in the end. Do the stars just crash? What happens when the graph looks like this:

DAY E
Today is the working setup presentation. I have created a PowerPoint presentation that describes my background, method, and first data run. Orbital mechanics is dry stuff. Hopefully, they'll like the chicken at the end. Murray suggests ten spans and...
max (range) - min (range) = (variation / mean (range)) = Forness coefficient
2

r (separation)
DAY F
Back to the computer with caffeine and chips. The data is not consistent like the first trial. There doesn't seem to be a pattern. I have been letting it run as long as I dare, but I can not find the cycle. I am going to graph it anyway. I just need to get through this eight more times.
DAY G
Today I finish the remaining trials. Now to write the paper...
DAY H
Research Defense. Still writing paper.
DAY I
Um...paper.
DAY J
"And God said to rest on the tenth day."
Astronomy 201, Martha Haynes. 26 August 2002. Cornell University. 7 November 2002. <http://astrosun.tn.cornell.edu/courses/astro201/binstar.htm>
Department of Physics and Astronomy. University of Tennessee. 7 November 2002. <http://cseplo.phys.utk.edu/astr161/lect/solarsys/binary.html>
Giancoli, Douglas C. Physics. New Jersey: Prentice Hall, 1998.
Imagine Team, Dr. Jim Lochner. 1997-2000. NASA. 7 November 2002. <http://imagine.gsfc.nasa.gov/docs/ask_astro/binary.html>
Physics and Astronomy Department, J.C. Evans. ©1995. George Mason University. 7 November 2002. <http://www.physics.gmu.edu/classinfo/astr103/coursenotes/ECText/ch14_txt.htm#14.2>
Random House Dictionary, The. "Gravitation." New York: Random House, ©1980.