Final Results Page .:. Go Up
Introduction .:. Theory
.:. Apparatus .:. Procedure .:. Results
.:. Discussion
Acknowledgements .:. Experimental video (37.9 Mb
.dv) .:. Video on
YouTube .:. Photos .:.
Links
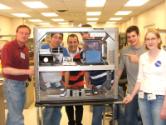
Andrew Bonica, Becky Entler, Adam Furman, Tim McNaught, Chris Murray
The height to which a fluid rises in a capillary tube is limited in the presence of gravity by the ever-increasing weight of the column of fluid. At some point the weight of the fluid counteracts the force of attraction between the tube and the fluid, and the fluid stops rising.
In a micro-gravity situation, we expect the fluid to rise up the height of the tube creating an oscillating balloon at the end. (Siegel, 1961) The energy of the moving fluid does not seem sufficient to overcome the surface tension and adhesion, and cause droplet formation if the tube is not tapered at the end. The research question, then, is whether changing the end of the tube will cause the fluid to be ejected out into the air.
It was our hypothesis that if we changed shape of the end of the tube the energy of the rising fluid would eject an isolated droplet in a micro-gravity environment.
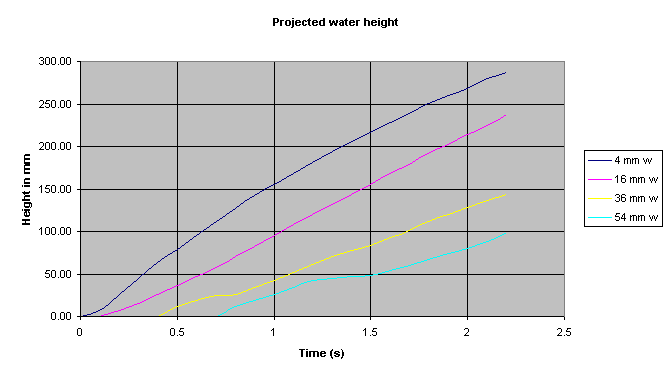
Michael Dreyer of ZARM was nice enough to share actual experimental data (Stange, Dreyer and Rath 2003) with us for our preliminary calculations. Specifically, one of the silicone fluids had the same kinematic viscosity as water – our working fluid, so we compensated for water’s slightly different density, and greatly different surface tension, and arrived at an approximate guess at where water would be when.
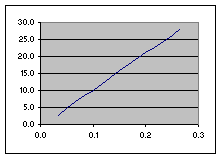
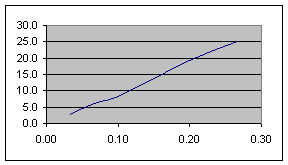
This allowed us to predict what length of tube we should use to get the water to the end of the tube in less than 2.2 seconds. Notice on the above graph, which is simply the data from ZARM scaled for water, that the smaller tubes achieved higher velocities, and the larger tubes showed oscillations of the meniscus due to the abrupt change from gravity to zero gravity. (ZARM 2004) We as a team decided to test both small diameter and large diameter tubes. We had a hunch that the smaller tubes would be the best.
Specifically, we were seeking local conditions described by a high Weber number at the orifice at the moment of drop creation. The Weber number is the density times velocity squared times the radius of the opening divided by the surface tension. We were advised to have a Weber number bigger than ten to create a droplet.
The apparatus consisted of two rectangular nesting boxes with a lid made from .375“ solvent welded polycarbonate plastic. The outer cell provided the required double containment for the facility. The water was then confined to the inner cell, which measured 6” wide, 5 “ deep, and 8.75 “ tall.
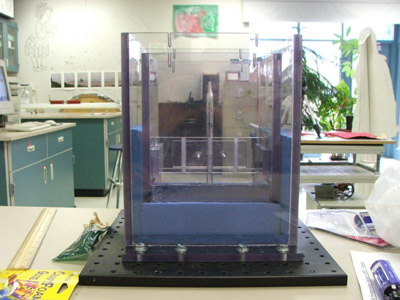
The apparatus with the lids removed showing a capillary tube in the holding bar
2 inches above the bottom of the inner cell there was a step decrease in the wall thickness. This was the level of the water reservoir for the capillary tubes. The cell walls above this point were coated with polytetrafluoroethylene (ptfe). The geometry of this provided a pinning edge to prevent the water from climbing further up the walls of the cell – the ptfe coating would aid as well. Around the capillary tubes we placed a rubber band and the portion above the water was coated with ptfe to prevent the water from climbing the outside of the tube. The tubes were held in position by being clamped to a holding bar that itself was above the water and pinning edge.
For capillary tubes, we either cut pipettes of different diameters to the desired length, or for the larger diameters we poked out the bottoms of test tubes with wire over a flame, and then sanded the raised bump we made until we had a hole in the bottom. This technique worked quite well in that we could create any exit diameter we desired.
IV.
Procedure .:.
Top
In order to conduct our experiment, we first needed to clean our test tubes and dropping apparatus. We did this by placing our tubes in a fume hood and cleaning the tubes and apparatus with ethanol and distilled water. We first cleaned the tubes and apparatus with ethanol followed by a thorough rinsing with distilled water. This was very important to ensure that the tubes and the apparatus were not contaminated by any outside substances to ensure the best possible wetting conditions.
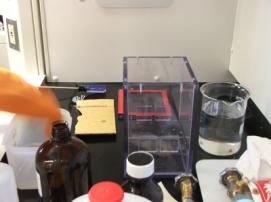
Cleaning the tubes in the fume hood
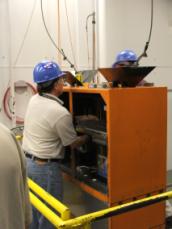
After the apparatus and tubes were cleaned, we then filled the inner cell with distilled water up to the pinning edge. The reason for which we only filled the inner-cell up to the pinning-edge was to ensure that the distilled water would not climb up the sides of the apparatus, and only the inside of the tubes. We then placed our chosen test tubes inside of the holding bar. We then placed the bar inside of the inner-cell so that the tubes were immersed 1 cm into the water. Once the holding bar was in place we screwed the lid of the inner-cell into place. Following this, we placed the inner-cell inside of the outer-cell and secured the outer-cell with screws. We also placed padding between the two cells to reduce that chance that they would break upon impact with the airbags at the bottom of the drop tower.
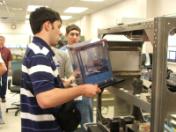
Placing the experiment in the drop rig, and adjusting the camera.
After the apparatus was secured, we attached it to the Educational Rig through the use of screws. On the dropping apparatus there was a camera that we needed to then adjust to show our desired reference frame. Once the desired frame was found, we taped the adjustment rings so they would not change by accident, and then carted the entire rig to the 5th floor where the NASA engineers placed the educational rig into the drag shield. Once this was completed, the engineers raised the entire thing to the top floor.
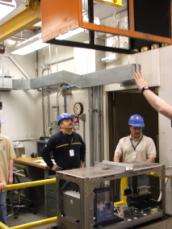
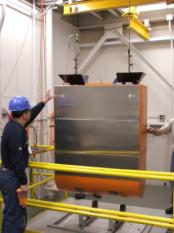
Placing the rig into the drag shield and lifting the experiment to the top floor
On the top floor, we performed a list of operations to film the drop. Once these steps were complete, the apparatus was dropped and our information was recorded.
We proceeded to complete these steps two more times with a variety of diameters of tubes and exit openings.
The data we have here was gathered by analyzing 30 frames per second video with a resolution of 640x480 pixels. To download the 40 Mb .dv file click here. The tubes were measured using a Vernier caliper. We measured the inner diameters of the exit hole, and the tube itself as well as the length over which the tube tapered to the exit diameter. The data from the graphs and in the data tables can be found on these links:
Results (Excel) .:. Dimensions (text) .:. Velocities and Weber# (text)
|
|
|
|
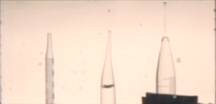
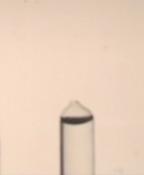
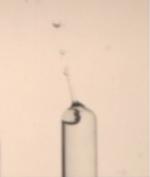
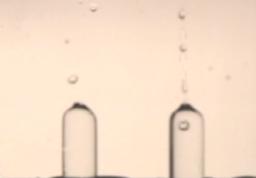
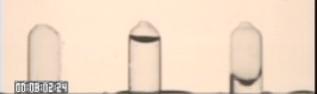
Figure 1a – A time sequence showing droplets emerging from three pipettes. The droplets emerge from the right tube first, and then the middle, and the leftmost tube released a drop about 1/30th of a second before impact with the air bag.
|
|
|
|
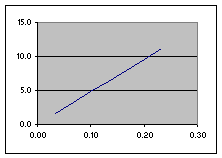
Figure 1b – Graphs of the motion of the water before it hits the tapered section of the tube. All vertical axes are height above the holding bar in millimeters, and all horizontal axes are time in seconds.
Tube Dimensions:
|
Drop
#1 |
Left |
Middle |
Right |
|
|
Inner
Diameter |
3.8 |
7.9 |
10.8 |
mm
+/- .1 mm |
|
Orifice
Diameter |
1.4 |
0.7 |
1.7 |
mm
+/- .1 mm |
|
Length |
117 |
116* |
117 |
mm
+/- 2 mm |
|
Taper
Length |
18 |
37* |
31 |
mm
+/- 2 mm |
|
Droplet? |
yes |
yes |
yes |
|
On the first drop we used three pipettes that were trimmed to our desired length. In this first drop, all three pipettes created and isolated droplets. We believe that this was due to the fact that the water was able to rise inside of the pipettes at a relatively short amount of time and create a strong force due to the narrow diameter. Interestingly, the more narrow tube barely released a droplet, while the larger tubes created a droplet in a shorter time – a result that was contrary to our preliminary analysis. This may have been due to wetting problems inside of the tubes, or to the different diameters of the exit hole – i.e. the air exiting the tube may have damped the motion of the water.
|
|
|
|
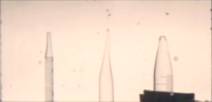
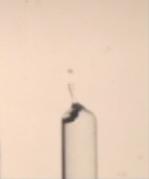
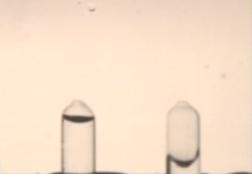
Figure 2a – A time sequence of the right tube creating droplets. Note the air trapped in the end of the tube.
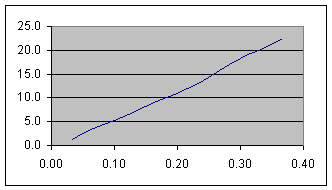
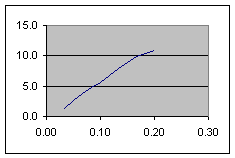
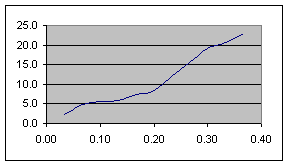
Figure 2b – Graph of the height above the holding bar vs. time for the water before reaching the taper. The vertical axis is height above the holding bar in millimeters, and the horizontal axis is time in seconds.
Tube Dimensions:
|
Drop
#2 |
Left |
Middle |
Right |
|
|
Inner
Diameter |
22.1 |
17.7 |
10.9 |
mm
+/- .1 mm |
|
Orifice
Diameter |
2 |
2.1 |
1.8 |
mm
+/- .1 mm |
|
Length |
83 |
94 |
102 |
mm
+/- 2 mm |
|
Taper
Length |
11 |
11 |
6 |
mm
+/- 2 mm |
|
Droplet? |
no |
no |
yes |
|
The second drop resulted in the formation of only one droplet. This drop was aimed to study the influence that the inner diameter of the tube had on the formation of droplets. The only tube that created a droplet was the smallest in diameter, proposing the idea that larger diameters either climb too slowly to make it to the top before 2.2 seconds, or the larger diameters are more susceptible to wetting problems. Due to visual limitations, we were not able to tell what happened.
|
|
|
|
|
|
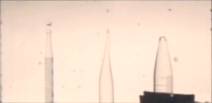
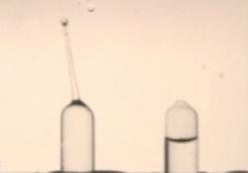
Figure 3a – A time sequence of the drops formed by the middle and right tubes in the third drop. Notice the bubble that is formed in the right tube actually moves down between the two frames.
|
|
|
Figure 3b – Graphs of the motion of the water in the tube before it reaches the taper. All vertical axes are height above the holding bar in millimeters, and all horizontal axes are time in seconds.
Tube Dimensions:
|
Drop
#3 |
Left |
Middle |
Right |
|
|
Inner
Diameter |
10.9 |
10.9 |
10.9 |
mm
+/- .1 mm |
|
Orifice
Diameter |
3.7 |
2.8 |
1.9 |
mm
+/- .1 mm |
|
Length |
102 |
103 |
103 |
mm
+/- 2 mm |
|
Taper
Length |
4 |
6 |
7 |
mm
+/- 2 mm |
|
Droplet? |
no |
yes |
yes |
|
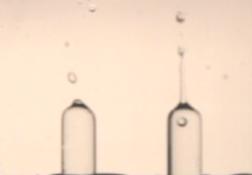
The third drop ended in only two of the three tubes creating a droplet. Each of these tubes had the same inner diameter but different orifices. We did this in order to study the effects a different orifice would have on the creation of droplets in micro-gravity. The smallest orifice (right) created the first droplet, the second smallest (middle) created the second droplet, but the third (left – not pictured) orifice did not create a droplet. We believe that this is because of a wetting problem because of the fact that all three tubes were the same except for the fact that they had different orifices. Unfortunately, the bottom of the tube was out of the camera’s view, so we can only guess what happened.
One effect we noticed before we did the drops was that of air damping. In larger diameter tubes with small exit holes, we could not form drops in our bench testing. The water simply could not push the air out of the way fast enough through the small hole, and hit the end of the tube very gently. All of the tubes we tried in the experiment had large enough exit holes so that we felt the air damping was negligible, but this was all done very unscientifically – we would gradually make the hole larger until the water seemed able to move up the tube quickly enough to make a drop when it hit the hole at the top of the tube.
Our first drop, though successful in making droplets, was a bit puzzling in that the tubes seemed to go in reverse order. Our ZARM data predicted that the smallest tubes would have the fastest rise in water height, and the largest would be slowest. This is the exact opposite of what we saw. Again, we think it was unreliable wetting. The menisci of the tubes that did wet approached the tops to the tubes in a very haphazard manner, with different edges sometimes lagging behind, and sometimes racing ahead as the water encountered different contaminants (we imagine) inside the tube. We imagine that such effects would dwarf the effect of the tube diameter. The tubes that climbed the fastest were probably the ones with the best wetting characteristics.
The Weber numbers we calculated from the experiment agreed pretty well with our predictions. The table below contains the data used to calculate the Weber number as well as the Weber numbers themselves:
|
|
Drop
1 L |
Drop
1 M |
Drop
1 R |
Drop
2 R |
Drop
3 M |
Drop
3 R |
|
Approach
velocity in mm/s |
109.33 |
47.83 |
57.40 |
63.81 |
96.26 |
61.52 |
|
Tube
Inner Diameter in mm |
3.80 |
7.90 |
10.80 |
10.90 |
10.90 |
10.90 |
|
Exit
Diameter mm |
1.40 |
0.70 |
1.70 |
1.80 |
2.80 |
1.90 |
|
Weber
Number |
6.3 |
180 |
63 |
68 |
41 |
54 |
The approach velocity was calculated by analyzing the 30 frames per second video and charting the motion of the meniscus before it entered the tapered part of the tube. The velocity we used for the Weber number was simply the velocity of the water before it reached the taper increased by the ratio of the cross sectional areas of the tube itself and the exit hole.
The only Weber number that is below the 10 we thought we needed was the left tube in the first drop. It had a Weber number of 6.3, and if you watch the video, it seems as if the tube just barely squeezes out its drop. In the same drop, the right tube had the highest Weber number, and on the video, you can barely see the drop it forms as it fairly rockets off the screen before you can see it. The Weber number, representing the ratio of kinetic drop-forming energy divided by the surface tension, which is the tendency to constrain the droplets, then, seems to be a good model for predicting drop formation in zero gravity.
Further work should be done using more reliably wetting materials like acrylic plastic and silicone oil. Specifically, it would be interesting to pursue a number of things. First, it would be interesting to see how small a Weber number we could have and still form a drop. One could see also if the length of the tube matters as well – it seems that it might in the sense that the longer the tube, the greater mass of liquid moving, and the greater the net kinetic energy. Lastly, it would be interesting to observe the dynamics of a gradually tapering tube. Perhaps a team from our school could do this next year.
None of this wonderful science would have been possible without help from Mark Weislogel of Portland State University, Michael Dreyer and Michael Stange of ZARM, John Easton, our NASA mentor, and the hard work of Richard DeLombard and the NASA DIME team that made us feel welcome. We thank you all.
Stange, M., Dreyer, M. E., & Rath H. J. (2003). Capillary driven flow in circular cylindrical tubes. Physics of Fluids. 15(9) 2587-2601
http://www.zarm.uni-bremen.de/2forschung/grenzph/isoterm/cap_rise/index.htm
Links .:. Top
http://www.zarm.uni-bremen.de/2forschung/grenzph/ - Stange, Dreyer and Rath's site with videos from their paper. The data for our experiment design came from their work.
http://www.zarm.uni-bremen.de/ - The ZARM home page. ZARM is a major German microgravity research center.
http://exploration.grc.nasa.gov/DIME.html - The DIME homepage - explains the program in which we participated.
http://exploration.grc.nasa.gov/balloon/blob.htm - What happens when you pop a water balloon in zero gravity?
http://exploration.grc.nasa.gov/drop2/ - The homepage for the 2.2 second drop tower we used.
http://www.ncmr.org/research/drop51.html - The homepage for the 5.1 second drop tower that is at GRC.
http://www.nasa.gov/centers/glenn/home/index.html - The Glenn Research Center homepage - turn up your speakers!
http://www.nasa.gov/vision/earth/everydaylife/defy_gravity.html - NASA Amusement park science - great flash videos of free fall rides and why you experience zero gravity when falling.